This appendix provides more information on the off-diagonal approach used in the selection of communities. The off-diagonal method is described in Chapter 3, so this section outlines the limitations of the method, and outlines the statistical method to calculate small area estimates of trust in government services, used for the off-diagonal method.
Limitations of Off-Diagonal Approach
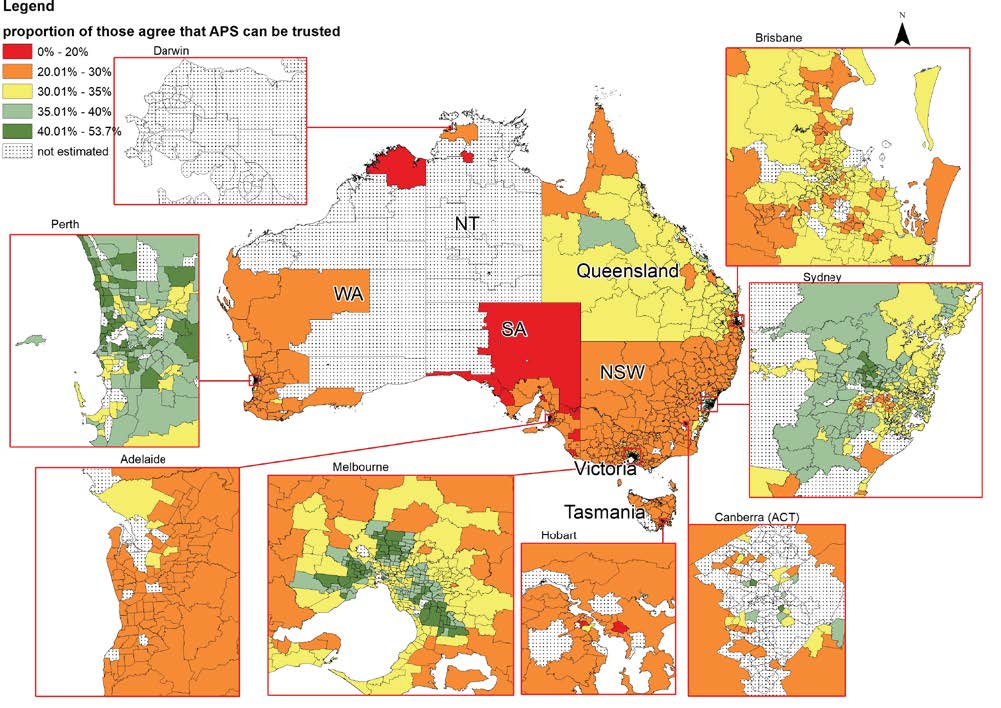
There are some limitations to the off-diagonal method. The main limitation is getting reasonable data from the modelled trust data across Australia, including remote areas. For technical reasons, the modelled trust data we use does not cover remote areas of all States (see Figure 4). This means that we didn’t just use the off-diagonal method to select communities – we had to look at other data available from data sources that could provide data for small areas reliably (eg, the Census and administrative data).
The second issue to take into consideration is if there is no off-diagonal area identified in the broad area we need a community for (eg, Eastern Victoria). This is handled by reducing the off-diagonal criteria – so rather than selecting a community in the bottom quintile of trust and/or service provision, using the second lowest quintile. This was done for a number of communities – see, for example, Community 22 in Appendix 2.
Finally, it needs to be understood that this isn’t a nice, clean statistical process. Choosing the communities is a messy process that brings together quantitative data from different sources, qualitative data from others on what communities to avoid, and our own knowledge of these communities. The off-diagonal approach is only one input into this complex process.
Modelling trust data
Data on generalised trust from the HILDA survey (using the question “Generally speaking, most people can be trusted” and a response of 1 to 7) has been used by NATSEM in their spatial microsimulation model, and estimates at the suburb level after benchmarking to Census data came up with reasonable results after validation. The first step in this project has been to take the data from the Department’s survey (using all observations) and benchmark it to small area estimates of age (years), gender, region, State, country born, whether speaks a language other than English at home, employment status, household situation, household income and highest level of education. All these variables are available on the survey, the 2016 Census, and all are correlated with trust in Government (important for our modelling). A description of the spatial microsimulation process we use is in Tanton et al. (2011).
The modelling has a technical limitation in that it can’t calculate estimates for many remote areas. Sometimes, removing a benchmark will mean that the model will work, but the result will be less accurate. At some point, we have removed so many benchmarks that we consider the result unreliable.
In deciding whether an estimate is reliable for an area, we use a criteria which compares the modelled total population with the estimated population. If it is different by more than 50%, we remove a benchmark and run the model again. For the estimates of trust, we removed up to 2 benchmarks before deciding we couldn’t get a reliable estimate for an area.
The modelled estimates of trust in government services have then been validated against the small area estimates of generalised trust already available. We would hope to see a correlation, but also some differences. We also validated by showing the maps at the technical co-design workshop with PM&C and others and asking for feedback on the patterns. This is called a ‘sniff’ test – do the numbers hold true with reality based on the experience of a group of experts? All these are standard ways of validating results from spatial microsimulation models (Edwards and Tanton 2013).
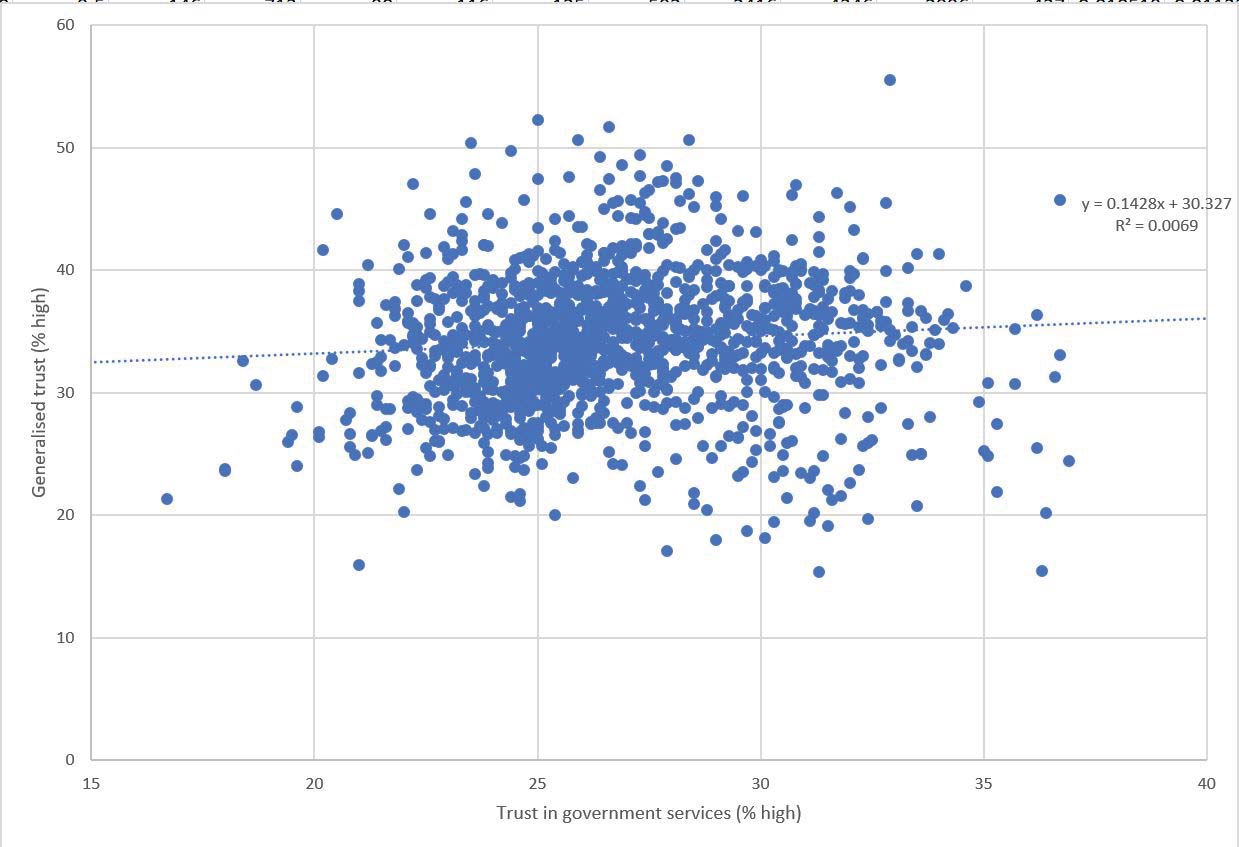
Figure A3.1 shows the correlation between the generalised small area trust from HILDA; and the small area trust in government services. It can be seen that there is very little relationship between these two estimates, possibly because they are measuring two different things.

Due to the validation (technical validation failed but expert group considered the estimates good), a decision was made to only use the small area estimates of trust in government services to inform our community selection. So the off-diagonal method using these estimates was used as an input into the selection of communities, but was not the only thing considered. The map used for this validation is shown in Figure A3.2.

Determine availability of services
The method proposed was to develop an index of service availability and use. In the end, this index was created, but wasn’t used in the final community selection, where we looked mainly at DSS recipients, but also considered students and hospital bed days separately. This was because the DSS recipients were the only Commonwealth service measure we had – both students and hospital beds were State services.
While the modelled trust and DSS recipients enabled us to map the off-diagonal communities, as explained above, the technical validation meant that we also needed to consider other contextual characteristics as shown in the table in Appendix 2. Where suitable data were available, community profiles were developed and mapped for all SA2’s across Australia that helped identify core contextual characteristics for further consideration in the community selection process. The selected study communities:
- Included a range of socio-demographic contexts (eg. age, unemployment, education, indigenous %, etc)
- Included a range of populations (eg. small, medium and large communities)
- Included a range of economic conditions
- Drought and non-drought (or other natural disasters)
- Economic sector profile (eg. dominant industry and multiple industry communities)
- Various industry sectors (eg. tourism, dairy)
- Considered different political affiliations (eg. voting, swings)
- Considered Australian government public service usage and complaints
- Considered current/recent policy interventions and investment (eg. Cashless Debit Card pilot program, regional deals, CDP areas, large scale infrastructure investment).
