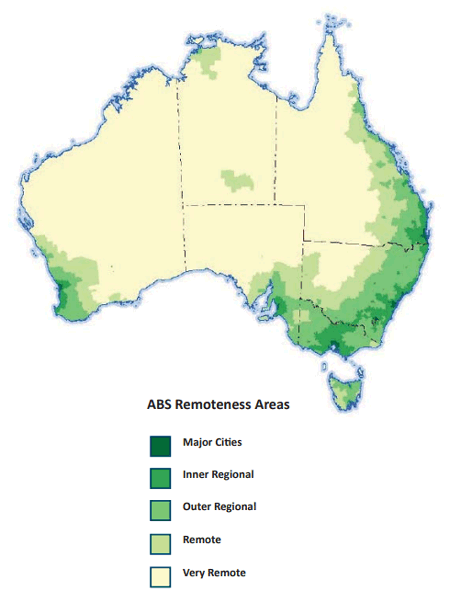
This section explores how people living in major cities and in inner and outer regional areas experience Australian public services differently.
Individuals in remote and very remote locations are not included in results, owing to the low number of respondents from these areas (0.8%).
Who did we survey?
- Metropolitan (Major Cities): 75%
- Regional 25%
- Inner: 18%
- Outer: 6%
- Remote: 0.8%

Lower trust
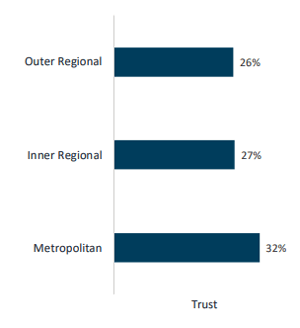
Trust in Australian public services is lower in regional areas than in metropolitan areas.
Similar satisfaction
Service satisfaction and channel use do not appear to explain this gap.
Feedback
Dissatisfaction in regional areas with feedback handling may help to explain the trust gap.
Trust in Australian public services is lower in regional areas
Respondents living in regional and metropolitan areas report similar patterns of accessing services-both in the services themselves and the reasons for doing so.
Trust in Australian public services is lower in regional areas than it is in metropolitan areas (27% versus 32%). In particular, trust is lowest amongst people in outer regional areas (26%). This is statistically significant. Whether trust is lower in remote and very remote categories cannot be determined at this point given a small sample size.
A greater proportion of metropolitan respondents agree Australian public services are competent and uphold values (~30%) than regional respondents (~25%). Metropolitan and regional respondents indicate responsiveness is an issue by. Regional respondents also indicate fairness is an issue.
Desire for change does not substantially differ
Almost the same proportion of metropolitan and regional respondents agree services need to change in the future to meet evolving needs (38-40%). A smaller proportion of respondents across these two cohorts trust Australian public services to implement those changes (23-25%).

Depends on where you are in the country and who you have to deal with.
Satisfaction and channel use do not explain the trust gap
Satisfaction is mixed
Throughout the results, there is no clear explanation identified for this trust gap.
When comparing levels of expectation and satisfaction between metropolitan and regional people, there are no significant differences.
Additionally, when further broken down, outer regional people (the least trusting) report a higher level of overall service satisfaction (52%) than inner regional respondents, who report the lowest overall service satisfaction (47%).
Despite the highest overall satisfaction, metropolitan people are more likely to report significant effort to access and receive services (32%) than their regional counterparts (28%).
Satisfaction drivers (such as being treated with respect, being kept aware of progress and wait times throughout) do not differ between metropolitan and regional cohorts.
Channels are similar
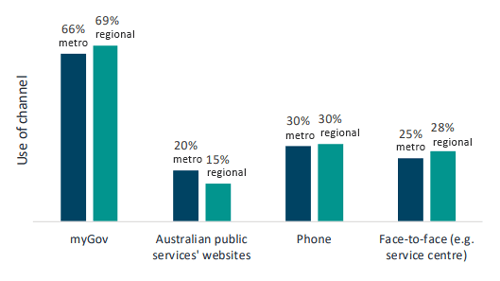
Channel use is also similar. In metropolitan and regional areas most people use one channel to access services (53%) with the primary channel being myGov (66-69%).
Metropolitan respondents tend to use APS websites more than their regional counterparts (20% versus 15%).
Metropolitan respondents are more likely to report a desire to change the way they interact with services in future (17%). Regional respondents are more likely to report an inability to change the way they interact (22%).

Feedback may help to explain the trust gap
Similar proportions of regional and metropolitan respondents provide feedback (18-20%).
Metropolitan respondents report providing the most suggestions for change, while regional people report providing the most compliments and complaints. The proportions however are not significantly different.
Metropolitan respondents are more satisfied with how their complaints and suggestions for change are handled (34%) when compared with regional respondents (23%).
Regional respondents also report greater dissatisfaction with how their complaints and suggestions for change are handled (26%) when compared with metropolitan respondents (20%).
Lack of responsiveness, no reliable criteria for assistance...
