This section explores how people with different types of employment experience Australian public services.
People who participate in the labour force, retirees, the unemployed and those permanently unable to work feature in results.
Who did we survey?
- Full time: 34%
- Part-time: 15%
- Casual/Temporary: 8%
- Unemployed: 11%
- Not actively looking for work: 7%
- Retirees: 20%
- Permanently unable to work: 4%
Reasons
People in precarious employment, the unemployed, and those permanently unable to work are likely to have three or more reasons to access services in the last twelve months.
Complaints
People permanently unable to work provide the most complaints about services.
Change
More than half of people permanently unable to work think services need to change in the future - but only 25 per cent trust the APS to implement those changes.
Trust and satisfaction
People permanently unable to work are the least trusting and most dissatisfied with services.
People in precarious employment and the unemployed are likely to have three or more reasons to access services in a year
Many reasons to access services
Full-time employees (36%), retirees (34%) and those not actively looking for work (33%) are more likely to only have one reason to seek access to services in a twelve month period.
In contrast, casual/temporary workers, part-time employees, those permanently unable to work, and the unemployed are more likely to have three or more reasons to seek access to services in a 12 month period (ࣙ or equal to 33%). Almost half of unemployed people have three or more reasons to access services (46%).
Complex reasons for interaction
Among full-time and part-time workers, as well as retirees, submitting an annual tax return is the most common reason for accessing services (49%-70%) and travelling overseas is the second most common reason (20-28%).
For casual/temporary workers and unemployed persons, looking for work is a top reason (27% and 60% respectively).
Those permanently unable to work report disability (58%) and experiencing a chronic condition or illness (45%) as the top reasons for accessing services.
Except for those permanently unable to work, Centrelink, Medicare and the ATO are the top three services accessed.
For those permanently unable to work, the top four were Centrelink (79%), Medicare (36%), the NDIS (21%) and the PBS (19%).
...always given different information from different people about the same thing.
Those permanently unable to work are the least trusting and least satisfied and they want change
A lack of trust
Full-time employees (31%) and retirees (37%) have the highest trust in Australian public services. Those permanently unable to work have the least trust in Australian public services (22%).
Those permanently unable to work have particularly low agreement in the APS' ability to be open and honest (20%) and fair (21%).
Appetite for change but a lack of trust
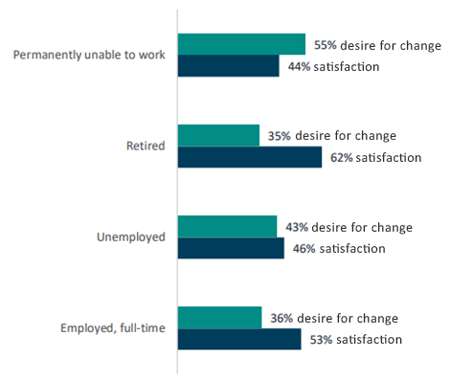
Those permanently unable to work (55%) and unemployed persons (43%) report the greatest desire for services to change in the future to meet evolving needs. Approximately 25 per cent of these cohorts trust Australian public services to implement the required changes.
Service expectations remain high but satisfaction is low
Across employment cohorts, including those permanently unable to work, respondents have moderate to high service expectations.
Mirroring results for trust, retirees have the highest service satisfaction (62%) and lowest dissatisfaction (7%) while those permanently unable to work have the lowest service satisfaction (44%).
Those permanently unable to work have particularly low satisfaction with being kept informed of progress and wait times (34%). They are most satisfied with being treated with respect (53%) but this result is still lower than other employment cohorts.
When accessing more than one service, those permanently unable to work report moderate effort to access and receive services, and only one in five (20-24%) understand which services to access and when. Overall, retired persons report less effort and greater 'know how' in navigating services.

Those permanently unable to work and the unemployed are least satisfied with handling of feedback
High usage of phone and in-person contact and an inability to change
While all cohorts most commonly use myGov to access services, the unemployed, those not actively looking for work and the permanently unable to work have the highest use of phone and in-person contact.
A quarter of those permanently unable to work report an inability to change the way they interact with services (26%).
Dissatisfaction with feedback handling
With the exception of those not looking for work, approximately one in five people provided feedback to services (compliment, suggestion for change or complaint).
Those permanently unable to work report the most complaints (42%). In this cohort, they also report low satisfaction (26%), and high dissatisfaction (30%) with how their feedback is handled.
Around a third of unemployed persons provide suggestions for change (31%) and just under a quarter report submitting a complaint (24%).
Unemployed persons are the least satisfied (18%) and the most dissatisfied (34%) with how feedback is handled.
One department does not know what another is doing and for that matter people in the same department give you conflicting information
