Exploring Feedback
Almost one in five respondents who accessed services provided feedback.
Yet just a third were satisfied with how their complaint or suggestion for change was handled.
This section explores feedback.
Satisfaction
Just under one in five people report they provide feedback to one or more services. Yet around one third are satisfied with how their feedback is handled.
Desire for change
People who want to change how they interact with services provide more feedback than others.
Who's providing feedback?
Just under one in five people provide feedback to Australian public services (19%). Of those who make a suggestion for change or a complaint, around a third are satisfied with how it is handled (32%)
Age: Almost a quarter of people in the lower age groups (18-34 years) provide feedback (24%). The lowest level of feedback is provided by people aged 45-54 years (15%).
Income: High levels of feedback are provided by people earning less than $20, 800 p.a. (24%). Low levels of feedback are from respondents earning more than $91,000 p.a. (17%).
Employment: Feedback across employment categories is largely consistent. Lowest levels of feedback come from those not actively looking for work (12%). In other employment categories 17-21 per cent of people provide feedback.
Number of services used: One-fifth of multi-service users provide feedback (20%). This is more than single service users (17%).
Channels: Almost two-thirds of the people who used social media to access a service provided feedback (60%). In contrast around one quarter of people who use the phone and access services in-person provide feedback (28% and 25% respectively). People who use myGov report the lowest levels of feedback (18%).
Respondents who want to change how they interact with services provide more feedback than others (36%).
Expectations: Most people who report high expectations of services provide compliments (59%).
Equally, most people who report low expectations of services make complaints (66%).
People who want to change how they interact with services tend to provide more feedback
Reasons: People with travel and long-term movement reasons to access services provide the second-highest proportion of compliments (47%), the lowest proportion of complaints (16%) and are most satisfied with how a suggestion for change or complaint is handled (49%).
People with a reason related to revenue provided the highest proportion of compliments. People with a reason related to education provide the highest proportion of suggestions for change (39%).
People with a reason related to registrations and civic participation report the highest proportion of complaints to services (36%), and greatest dissatisfaction with how their feedback is handled (38%).
Satisfaction: People who provide compliments are also generally satisfied with how Australian public services demonstrate a commitment to values, for example respect and fairness.
People who make complaints are generally dissatisfied with the responsiveness of Australian public services (e.g. how long it took to get what they needed, being kept informed of wait times and progress throughout).
Almost two-thirds of people who make complaints also feel it took a lot of effort to access and receive services (64%).
Trust & the non-aligned
The majority of respondents are non-aligned on their trust in Australian public services (i.e. respondents who somewhat trust. neither trust nor distrust or somewhat distrust Australian public services).
This section explores what can be done to encourage more non-aligned respondents to trust Australian public services.
Somewhat trust
Over a quarter of respondents 'somewhat trust' Australian public services but they hold back from fully trusting.
Uncertainty
Lack of service consistency and awareness of APS roles, responsibilities and accountabilities breeds uncertainty.
Understanding the non-aligned
Trust is integral to an effective APS. Trust provides a bond facilitating cooperation, reducing transaction costs, promoting inclusion and reinforcing social cohesion. It also creates space for future change and is a critical commodity for reform.
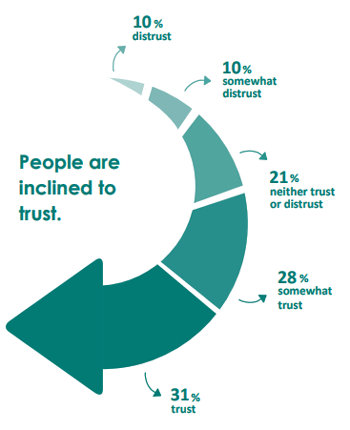
Trust in Australian public services is low. Less than one third of respondents report they can trust Australian public services (31%). However, just 10 per cent of people distrust Australian public services. Trust is not a binary concept. Rather, the majority are non-aligned (i.e. they only somewhat trust, neither trust nor distrust or somewhat distrust Australian public services) (59%).
By definition, the non-aligned report they cannot fully trust or distrust Australian public services.
Given the benefits trust provides, understanding how we can shift the non-aligned to place more trust in Australian public services is important.
Who are the non-aligned?
Analysis shows the non-aligned have no specific distinguishing demographic characteristics. They span age groups, geographic location, education, employment and income.
There are no particular reasons (e.g. having a baby, becoming unemployed) for accessing services associated with non-aligned respondents.
Apathy and ambivalence were not found to be major reasons for non-alignment. Results showed the non-aligned group considered their responses and were engaged in the Survey.
It is also important to note the inclination to trust Australian public services is positive with 28 per cent of the non-aligned group 'somewhat trusting' Australian public services. More than half of survey respondents somewhat trust or trust Australian public services (59%).
The non-aligned reported accessing services less often and rely on others' experiences to determine their own levels of trust. Logically, given fewer engagements with the APS, the non-aligned also reported a lack of awareness of the APS, its role and responsibilities.
More analysis will be carried out to understand the non-aligned and particular the group that 'somewhat trust' Australian public services.

I have had mixed service some people do a better job than others
Consistency and awareness are fundamental
Inconsistent service delivery leaves people less inclined to trust Australian public services
Of people who reported dissatisfaction with service consistency across interactions, over half (52%) did not trust Australian public services.
Of those neither satisfied nor dissatisfied with service consistency across interactions, three quarters (75%) were non-aligned on their trust in Australian public services.
Every experience matters
Consistent service delivery is crucial
Findings highlight specific areas where consistency is an issue. This includes managing and responding to feedback, and in responsiveness.
Of those who were neither satisfied nor dissatisfied with how their feedback was handled. 69 per cent were non-aligned on trust. Of those who were neither satisfied nor dissatisfied with how long it took to get what they needed from a service, 72 per cent were non-aligned on trust.
Consistency in service delivery should be a primary consideration within and across APS agencies in all aspects of the design and delivery of services.
Uncertainty in the ability to trust Australian public services is heightened by a lack of awareness of roles, responsibilities and accountabilities
Help the public know the unknown
In many cases, respondents reporting being unaware of the core values of the APS, and existing accountability frameworks. This lack of awareness heightens uncertainty.
This points to a need for greater awareness raising around the frameworks already in place to hold the APS to account through legislation, the Executive and by the Parliament.
Early, frequent and consistent public engagement on service delivery design and reform will help public awareness of the APS. Community consultation to develop tailored, fit-for-purpose services is a significant opportunity.
Financial Assistance
When people seek access to services, they do so for a primary purpose. This purpose may be to receive information or training, to comply with a requirement or to receive financial assistance.
This section focuses on people who sought access to services for the primary purpose of receiving financial assistance.
Multiple Services
Approximately half of those seeking financial assistance access multiple services and use two or more channels to access them.
Low trust
Expectation, satisfaction and trust is low for those seeking financial assistance.
Access
People seeking financial assistance report lower understanding of which services to access and how to access them.
Understanding those seeking financial assistance
Over half of respondents access Australian public services for financial assistance
Demographics: Those seeking financial assistance are likely to be under 45 years, living with a partner and dependants. While the majority live in a metropolitan area, they have the highest proportion of people living in regional areas. There is a higher likelihood they are unemployed. They typically earn less than $91, 000 p.a. and are likely to have a certificate-level or tertiary education.
Number of services used: People seeking financial assistance most commonly use Centrelink (68%). They are more likely to be multi-service users (access two or more services 54%) compared to others (45%).
Expectations: Those seeking financial assistance are less likely to report high expectations (36%) than others (43%).
Satisfaction: Those seeking financial assistance report lower satisfaction (49%) than others (55%). Dissatisfaction among those seeking financial assistance is particularly high in the areas of length of time to achieve an outcome (17% compared to 12% for others) and being kept informed of progress (15% compared to 11% for others).
Navigating services: People seeking financial assistance report the highest effort (39%) to access and receive services compared to others (31%). They also report slightly lower understanding of what services to access (33% compared to 35% for others) and how to access them (32% compared to 34-36%). They report higher rates of needing to repeat themselves to multiple agencies (34% compared to 27%).
Those seeking financial assistance see a need for service reform
Feedback: People seeking financial assistance are slightly more likely to make complaints (27% compared to 24%) and suggestions for change (34% compared to 29%).
Future trust and change: Those seeking financial assistance are more likely to agree Australian public services need to change to meet the needs of all Australians (44% compared to 35% for others).
They are also more likely to distrust the ability of services to implement changes (15% compared to 9% for others).
Channels: People seeking financial assistance are more likely to use two or more channels (49%) than others (35%). They more commonly interact in-person (31% compared to 20%) and use smartphone apps more regularly (17% compared to 9%).
People in the call centre would say I definitely could, and then when I applied I would be rejected
Mapping Trust
Maps present an otherwise unseen narrative of service delivery. Through the Survey PM&C is working towards the creation of representative maps of trust in Australian public services.
This section discusses the benefits and future opportunities that mapping can provide.
Trust
Trust in Australian public services differs dependent on a person's geographic location.
Clarity
Mapping presents a way to clarify why a difference in trust exists by geographic location.
What value can mapping add?
People living in regional areas have lower trust in Australian public services than in metropolitan areas. The reasons behind this result are currently unknown
Trust in Australian public services is lower in regional than in metropolitan areas (27% versus 32%). The difference is not large but it is statistically significant and currently unexplainable.
Analysing people through more than one demographic lens (e.g. age) will go some way to understanding why this difference is present.
Mapping presents an additional analysis method to assist our understanding of what may be behind the trust gap.
A visual representation of data (such as a map) can show patterns and trends otherwise unseen through pure statistical analysis.
Maps provide clarity
Maps are also a versatile method to link together data. Once a map of trust in Australian public services can be established, it will be possible to layer this map over other maps. For example, it would be possible to layer the trust map over a map of service provision locations.
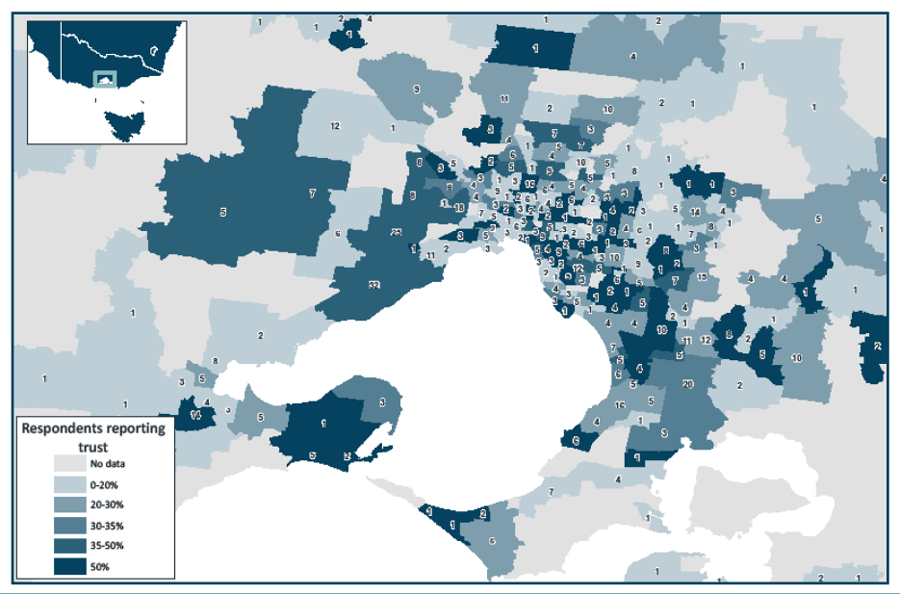
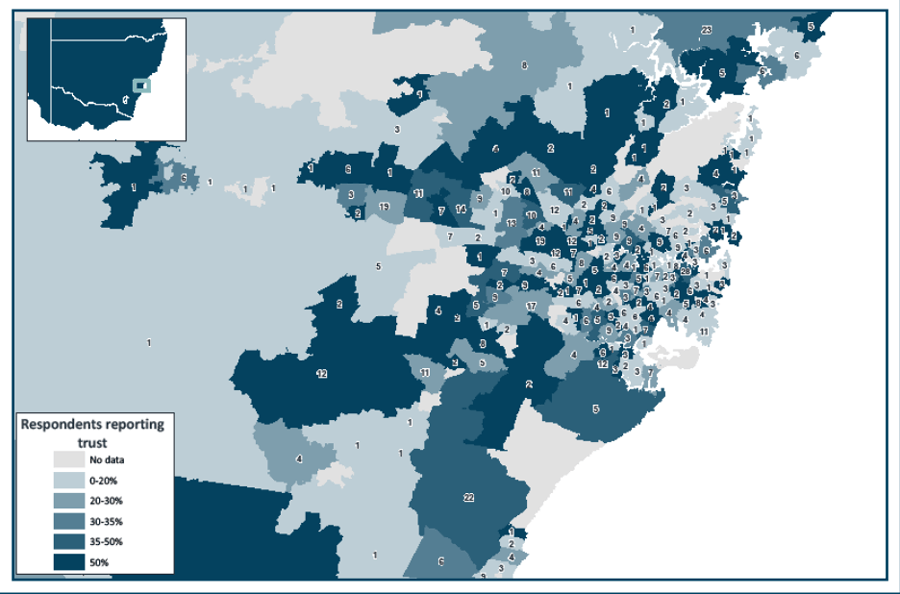
It will also be possible to map trust via different categories. As demonstrated over the page the Survey is already collecting data and is able to establish limited, non representative maps of wider Sydney and Melbourne areas. These maps are categorised by postal area. In future it will be possible to map data for example by regional area type (major city, inner and outer regional, remote and very remote), city size (small town, suburb and major city) and a variety of other options.
In future with further surveying mapping will continue and results will allow continued exploration of the regional trust gap. Results will also highlight the reach of the Survey and where other forms of research are warranted to fully understand the service delivery landscape (e.g. very remote areas).
As the Survey collects more data in regional and remote areas, there is the potential to create detailed maps of trust in Australian public services.
Below are two examples of major city locations that provide a snapshot of what will be possible.
Melbourne and surrounds
Trust in Australian public services by Postal Areas

Sydney and surrounds
Trust in Australian public services by Postal Areas

Note: Numbers indicate the number of people surveyed in that area.
