This section explores how people of different ages experience Australian public services. A focus is placed on younger (18-34 years) and older people (65 years + ).
Who did we survey?
- 18-24: 12%
- 25-34: 18%
- 35-44: 19%
- 45-54: 18%
- 55-64: 16%
- 65+: 18%
Multiple services
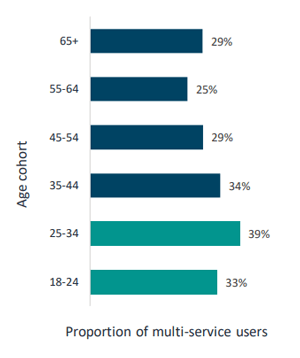
Over a third of young people reported accessing two or more services and are more likely to use multiple channels.
Greater effort
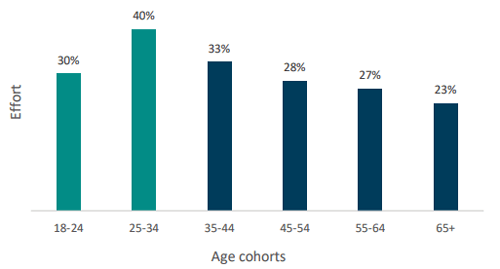
Young people require greater effort to access services than any other age groups.
Satisfaction and experience
Young people and older people reported both higher satisfaction and expectations.
Over a third of young people reported accessing two or more services for the same reason
High demand for services
Over a third of young people have three or more reasons to access Australian public services in a 12 month period (36%). In contrast, older people are more likely not to have a reason to access services (22%).
More young people access two or more services than any other age cohort (33-39%). While Centrelink, Medicare and the ATO are the top three services accessed across age cohorts, the Department of Jobs and Small Business (e.g. jobactive) is the next most accessed service by young people (10%).
Multiple channels
As respondents age, they tend to use one channel to access services-typically myGov. Young people are more likely to use two or more channels (e.g. myGov, phone) to access services.
Young people are more likely to interact in-person and over the phone than older people-but on these occasions report low service satisfaction. Young people are also more likely to indicate a preference to change how they interacted with services in the future.

Young people report more effort to access services
More effort required
Although young people have relatively average satisfaction when compared to other age groups, they report more effort to access services (36%).
This perceived effort tends to decrease with age.
Feedback more likely
Given this greater effort and the higher level of interaction already discussed, it is notable young people provide more feedback than middle-aged and older people (24% versus 16% and 18%).
Cohorts provide similar proportions of compliments, suggestions for change and complaints.
Young people are more satisfied than middle-aged and older people with how their feedback is handled. Those aged 45-54 years are markedly the least satisfied group (8% satisfaction and 41% dissatisfaction).
Demand for change
Middle-aged people are more likely to agree Australian public services need to change (40%), compared to young and older people.
The middle-aged cohort are also less likely to trust Australian public services to implement these changes (22%).

Young people reported higher satisfaction and expectations
Higher expectations
Young and older people report moderate to high expectations of services (>90% in both cohorts). In contrast, only 35 per cent of the middle-aged cohort report high expectations.
Older people are more likely than other cohorts to be satisfied with life in general (57% satisfied). Around one in five young and middle-aged people think others can be trusted, whereas this figure is almost one in three for older people (30%).
Older people trust more
Older people place more trust in Australian public services than young or middle-aged people (39% versus 27% and 33% respectively). A third of young people trust Australian public services (33%). Middle-aged people report the least trust in Australian public services (27%) and higher distrust (10-13%).
In the middle-aged cohort, 35-44 year olds have the least agreement that Australian public services are reliable, responsive, open and honest, fair, and have integrity (22-26%). In contrast, older people have the highest levels of agreement with these statements (33-38%).
Higher satisfaction
Young people and older people have greater satisfaction with services (52% and 63% respectively). Middle-aged people between 35-54 years have the lowest level of service satisfaction (45-47%).
Young and middle-aged people report lowest satisfaction with being kept informed of progress. Middle-aged people report low satisfaction with understanding how personal information is stored. Middle-aged and older people report low satisfaction with how easy it was to navigate the service.
Young people report more effort to access services than other age cohorts (36%).
I don't actually know enough about possible Australian services to know how to use them
