The following figures and tables provide the headline results of public satisfaction, trust and experiences with Australian public services for 2020-21. This consists of three survey waves (November 2020, February 2021 and June 2021), of approximately 5,000 Australians each.
Satisfaction with Australian public services
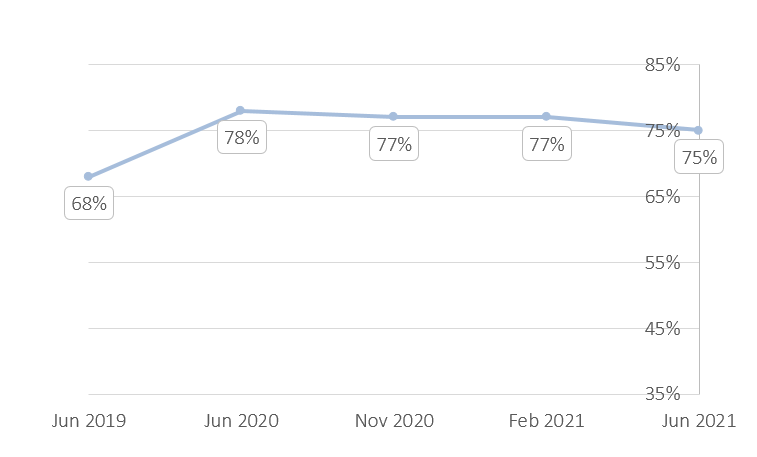
The survey measures how satisfied Australians were overall with the Australian public services they accessed in the last 12 months. 2020-21 saw a dip in satisfaction from the peak in June 2020, although satisfaction remains higher than in June 2019. In June 2021, results show 75% of Australians report feeling ‘completely satisfied’, ‘satisfied’ or ‘somewhat satisfied’ with their experience. A further 12% are ‘neither satisfied nor dissatisfied’, and 13% are ‘completely dissatisfied’, ‘dissatisfied’ or ‘somewhat dissatisfied’.
Satisfaction with Australian public services - November 2020 to June 2021
(June 2019 and June 2020 included to see trends over time)
Satisfaction with Australian public services - June 2019, June 2020 and June 2021
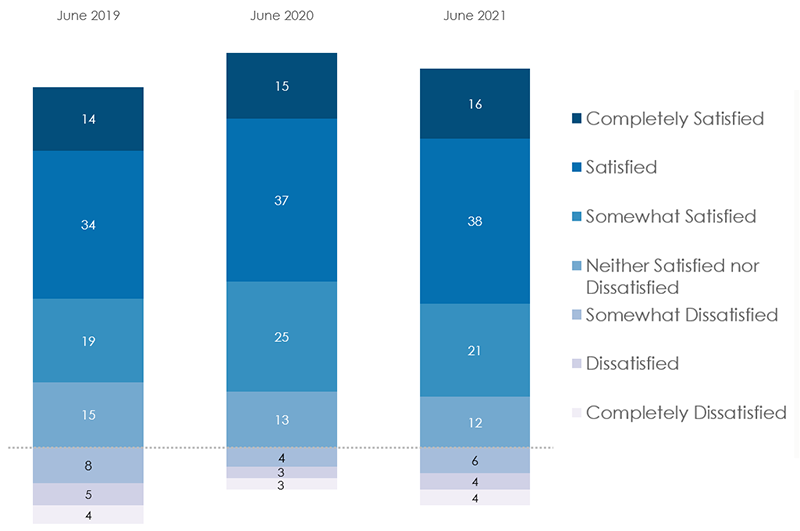
Satisfaction with Australian public services
(% of Australians satisfied/dissatisfied with services accessed in the last 12 months)
| June 2019 | June 2020 | November 2020 | February 2021 | June 2021 | |
|---|---|---|---|---|---|
| Completely satisfied | 14% | 15% | 18% | 18% | 16% |
| Satisfied | 34% | 37% | 35% | 39% | 38% |
| Somewhat satisfied | 19% | 25% | 23% | 20% | 21% |
| Neither satisfied nor dissatisfied | 15% | 13% | 13% | 11% | 12% |
| Somewhat dissatisfied | 8% | 4% | 5% | 5% | 6% |
| Dissatisfied | 5% | 3% | 2% | 3% | 4% |
| Completely dissatisfied | 4% | 3% | 3% | 3% | 4% |
Column totals may not add up to 100% due to rounding. Calculations using rounded estimates may differ from those published. All survey respondents who had accessed any services over the last 12 months were asked this question.
Trust in Australian public services
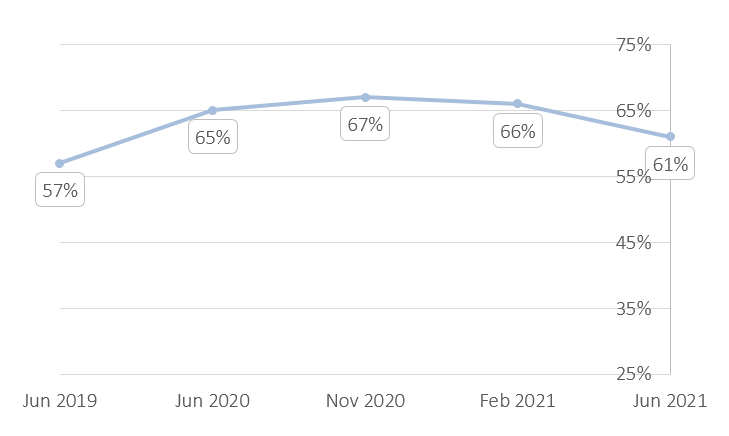
Australians’ perceptions of the trustworthiness of Australian public services are also captured in the Survey. Results from June 2021 saw a decrease in trust from February 2021, however trust remains higher than in June 2019 before a jump in satisfaction and trust during the COVID-19 pandemic. In June 2021, results show 61% of Australians ‘strongly trust, ‘trust’ or ‘somewhat trust’ Australian public services. A further 20% ‘neither trust nor distrust’, and 19% ‘strongly distrust’, ‘distrust’ or ‘somewhat distrust’.
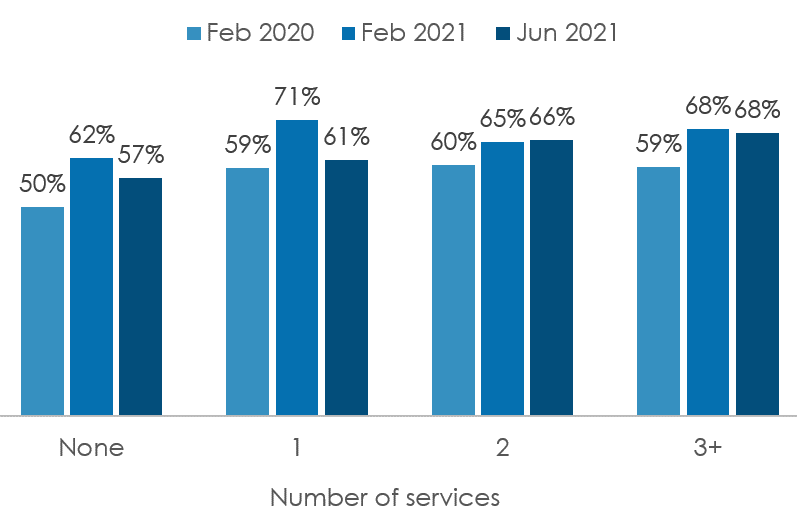
Positively, the decline in trust did not occur for people with more complex service experiences. Australians who accessed two or more services for a single reason experienced no decline in from February to June 2021.
Trust in Australian public services - November 2020 to June 2021
(June 2019 and June 2020 included to see trends over time)
Trust in Australian public services - June 2019, June 2020 and June 2021
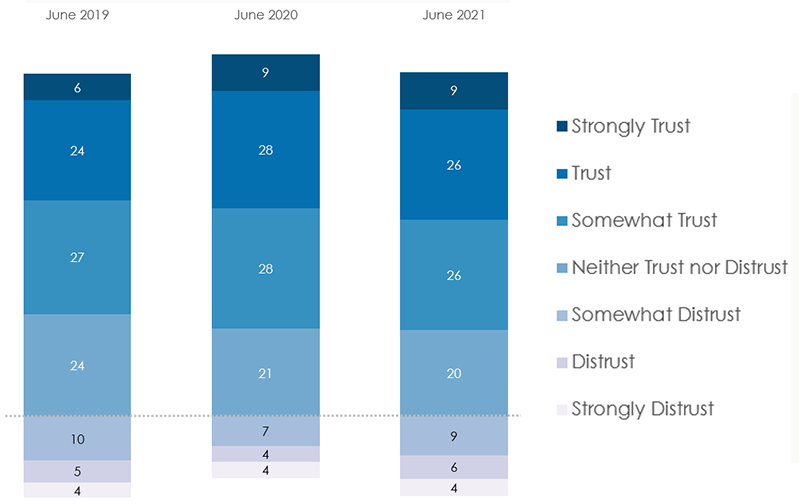
Trust in Australian public services
(% of Australians who agree/disagree with the statement ‘I can trust Australian public services’)
| June 2019 | June 2020 | November 2020 | February 2021 | June 2021 | |
|---|---|---|---|---|---|
| Strongly trust | 6% | 9% | 11% | 12% | 9% |
| Trust | 24% | 28% | 28% | 29% | 26% |
| Somewhat trust | 27% | 28% | 27% | 25% | 26% |
| Neither trust or distrust | 24% | 21% | 21% | 20% | 20% |
| Somewhat distrust | 10% | 7% | 6% | 7% | 9% |
| Distrust | 5% | 4% | 3% | 4% | 6% |
| Strongly distrust | 4% | 4% | 3% | 4% | 4% |
Column totals may not add up to 100% due to rounding. Calculations using rounded estimates may differ from those published. All survey respondents were asked this question, whether or not they had accessed a service in the past 12 months. Respondents rated their agreement or disagreement with the statement ‘I can trust Australian public services’; e.g. people who ‘strongly agree’ are counted as Strongly Trust.
Trust in Australian public services by number of services accessed for a single reason - February 2020, February 2021, and June 2021
Service delivery experience with Australian public services
The Survey explores how Australians experience services by asking a variety of questions about accessing and receiving services.
Service delivery experience
(% of Australians who 'agree' or 'strongly agree' with the following statements)
| June 2020 | November 2020 | February 2021 | June 2021 | |
|---|---|---|---|---|
| I got what I needed | 60% | 61% | 64% | 60% |
| It was easy to access the service(s) | 51% | 54% | 57% | 54% |
| The amount of time it took to reach an outcome was acceptable | 51% | 51% | 54% | 51% |
| Processes were clear and easy to follow | 49% | 49% | 53% | 49% |
| Information I provided to one service didn't need to be repeated to others | Not comparable to earlier waves | Not comparable to earlier waves | 46% | 45% |
Respondents rated their agreement or disagreement with the statement in the left-hand column. All survey respondents who had accessed any services over the last 12 months were asked this question.
Data provision
Further high-level results, including looking at the data by age and metropolitan/regional location (XSLX 79KB), are available.
Further detailed aggregate datasets are available on the data.gov.au website.
