[toc]
About the Survey of Trust in Australian public services
This is the second Image

| Feedback on Australian Image

|
Report shows feedback on Image

| Feedback on all life events Image

|
Over 55,000 responses collected since March 2019 Image

| Robust and reliable results. Image

|

For more details about the survey, go to www.apsreform.gov.au/research/trust-in-australian-public-services or email TrustandTransparency@apsc.gov.au
About the report
Results shown are from responses Image

| Image

Reporting on over 12,000 responses Image

|
Data collected from +1,000 people each month Image

| Nationally representative sample including: Image

|
Report shows feedback on 17 public services.
| For more results see |
Insights
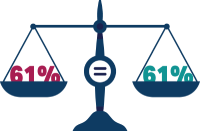
General trust in Australian public services is at 61%[1] with no changes since last year. Image

| People were most satisfied with their experiences with staff and the information they were given while accessing services. People were least satisfied with public service processes. Image

|
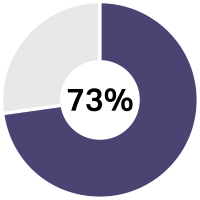
Trust in specific services used has remained stable at 73%[2] in 2023, the same as in 2022. The Department of Agriculture, Fisheries and Forestry had the largest increase from 2022 with an 11 percentage point increase, followed by the National Disability Insurance Scheme, with a 5 percentage point increase. Image

| Satisfaction remained relatively stable, dropping by 1 percentage point from 73% to 72%[3]. Image

|
An analysis of the drivers of trust and satisfaction shows how vulnerability, disadvantage and other life experiences are important factors for trust and satisfaction in addition to service experiences. Image

| 91% of people who trusted services were also satisfied[4] with them. 30% of people who distrusted services[5] were still satisfied with them. Image

|
Footer
[1] Q18 - General trust is the proportion of people who answered “strongly agree”, “agree” or “somewhat agree” when asked “How much do you agree with the following statement - ‘I can trust Australian public services’”.
[2] Q28 - Trust in specific services is the proportion of people who answered “strongly agree”, “agree” or “somewhat agree” when asked “How much do you agree with the following statement – ‘The service is trustworthy’” about a specific service. The proportion is adjusted pro rata for the amount of services each individual was asked about.
[3] Q20 - Satisfaction is the proportion of people who answered “Completely satisfied”, “Satisfied” or “Somewhat satisfied” when asked “Thinking about your overall experience with the above services, how satisfied or dissatisfied are you?”
[4] Q24 - Satisfaction with specific services is the proportion of people who answered “Completely satisfied”, “Satisfied” or “Somewhat satisfied” when asked how satisfied or dissatisfied they were with a specific service. The proportion is adjusted pro rata for the amount of services each individual was asked about.
[5] Q18 - General distrust is the proportion of people who answered “strongly disagree”, “disagree” or “somewhat disagree” when asked “How much do you agree with the following statement - ‘I can trust Australian public services’”.


