[toc]
In 2023...
Image
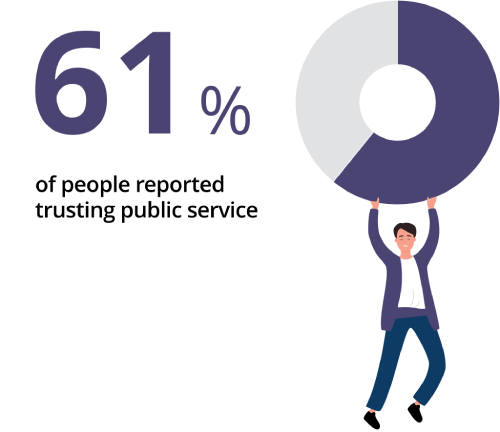
| Image
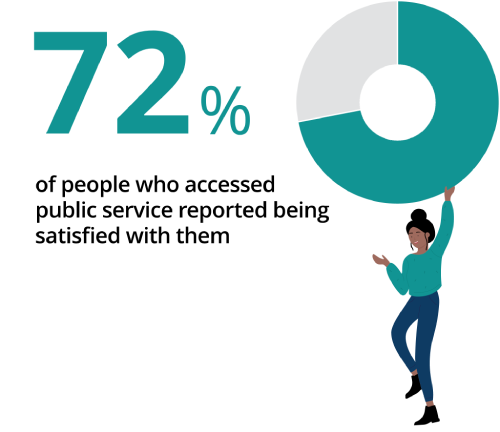
|
Image

How do we compare?Trust in Public Service Brand in New Zealand was 59% in 2023[6] Trust in public services across OECD countries was 50% in 2021[7] |
General trust and satisfaction over time
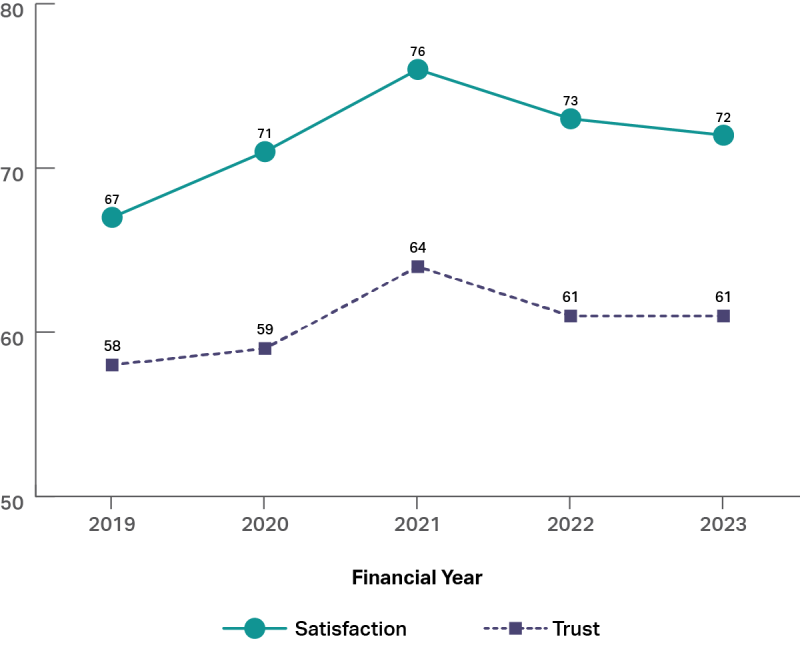
Results have remained stable over the past year. How do we measure what is a good progress for trust and satisfaction in public services?
Among other countries that study trust in public services specifically, there is a trend for trust in public services to be relatively stable and slow moving.
The stability is likely because:
- People do not think about public services unless a major event creates a significant need to access services (such as COVID or the 2008 recession).
- Public services need to perform better to maintain satisfaction as people’s expectations tend to grow over time.
See Section 2 ‘what drives trust and satisfaction’ for more details.
Trust is the proportion of people who answered “Strongly Agree”, “Agree” or “Somewhat agree” with the statement “I can trust Australian public services”
Satisfaction is the proportion of people who answered “Completely satisfied”, “Satisfied” or “Somewhat satisfied” when asked “Thinking about your overall experience with the above services, how satisfied or dissatisfied are you?”
Specific trust and satisfaction in services
Trust[8] and satisfaction[9] varies significantly between services
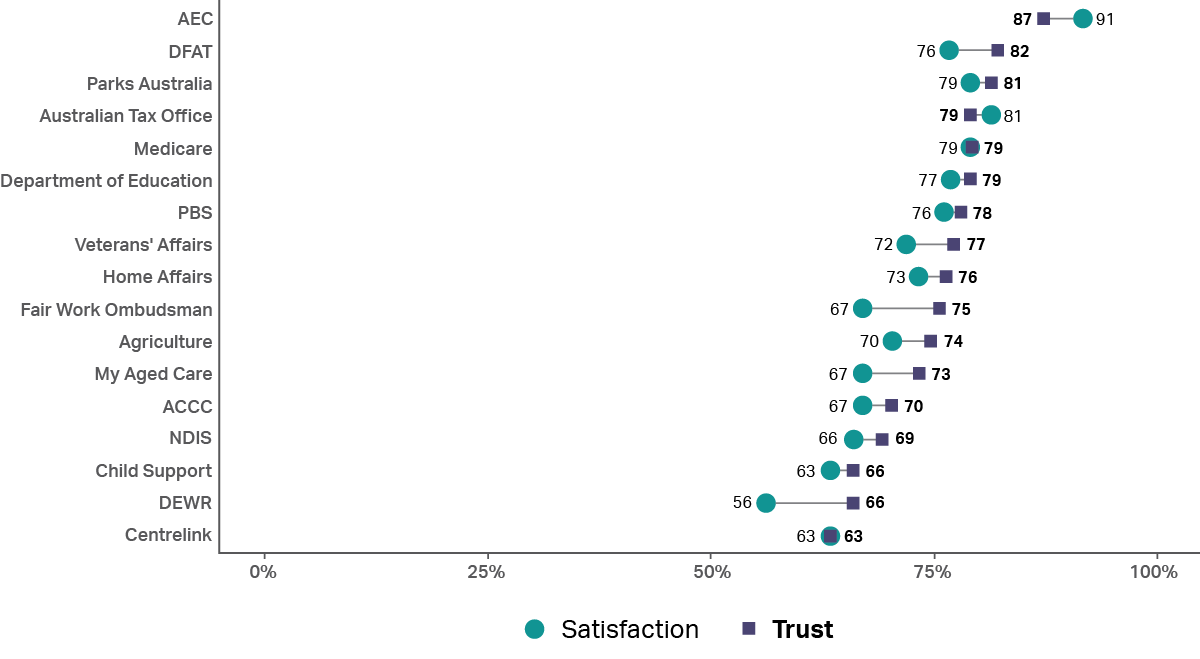
A fair comparison? Trust and satisfaction are a product of more than service experience. See Section 2 ‘what drives trust and satisfaction?’ for more details.
Want more detail on services? Section 3 of this report provides further results for each service.
Who trusts?
1. Life Satisfaction Image

| 2. Trust rust in people Image

| 3. Gender Image

|
4. Age Image

| 5. Regional and Metro areas Image

| 6. Income median weekly wage (above $1249) trust public services compared to 59% of people earning less than the median. Image

|
7. Education levels Image

| 8. Language spoken at home Image

| 9. Country people were born in Image

|
Co-occuring Factors
There is a common theme of disadvantage and vulnerability underpinning these factors that may be a more fundamental driver of trust. See section 2 for more details.
In what way were they satisfied?
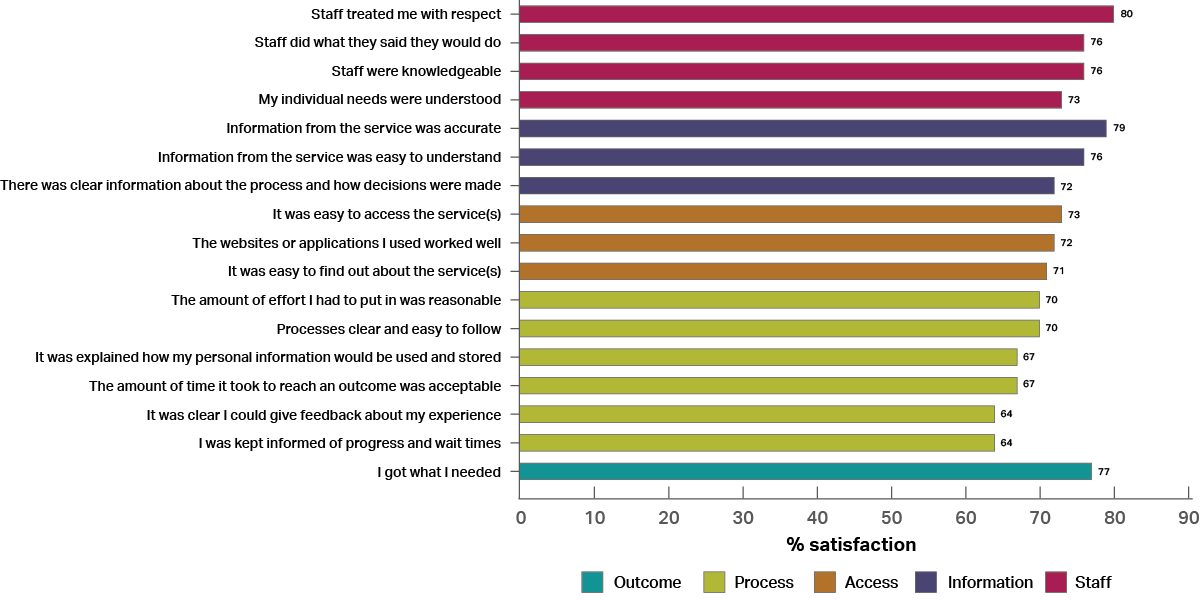
The aspects of satisfaction with public services with the highest satisfaction[13] in 2023 were primarily related to the way people were treated by staff and information quality. The greatest area for improvement relates to service process, such as keeping people informed of progress and wait times.
Image

| People were least satisfied with public service processes, although a higher proportion got what they needed at the end of the process. |
Footer
[6] Kiwis Count - Te Kawa Mataaho Public Service Commission
[8] Q28 - Trust in specific services is the proportion of people who answered “strongly agree”, “agree” or “somewhat agree” when asked “How much do you agree with the following statement – ‘The service is trustworthy’” about a specific service. The proportion is adjusted pro rata for the amount of services each individual was asked about.
[9] Q24 - Satisfaction with specific services is the proportion of people who answered “Completely satisfied”, “Satisfied” or “Somewhat satisfied” when asked how satisfied or dissatisfied they were with a specific service. The proportion is adjusted pro rata for the amount of services each individual was asked about.
[10] Q32 - Life satisfaction is the proportion of people who answered “Completely satisfied”, “Satisfied” or “Somewhat satisfied” to the question “Overall how satisfied or dissatisfied are you with life as a whole these days?”
[11] Q18 - General trust is the proportion of people who answered “strongly agree”, “agree” or “somewhat agree” when asked “How much do you agree with the following statement - ‘I can trust Australian public services’”.
[12] Q32 - Life dissatisfaction is the proportion of people who answered “Completely dissatisfied”, “Dissatisfied” or “Somewhat dissatisfied” to the question “Overall how satisfied or dissatisfied are you with life as a whole these days?”
[13] - Q21 & Q25 - Proportion of people who answered “Strongly agree”, “Agree” or “Somewhat agree” when asked how much they agreed with each statement in the graph.
