[toc]
An existing model underpins our understanding of trust and satisfaction
The relationship between trust, satisfaction and other important factors is well understood conceptually based on academic research.
Key points:
- Trust and satisfaction exist in a feedback loop, as set out in the diagram below.
- Trust conveys expectations about needs being met.
- Satisfaction is a product of the extent to which services live up to those expectations.
- Other independent factors feed in to that loop and ultimately influence trust, such as the individual characteristics and needs of the person doing the trusting, the action of the trustee (in this case the service experience) and other contextual factors.
In this section of the report, we use this model as a lens to provide insights on the drivers of trust and satisfaction in Australian public services. We provide nine insights, corresponding to nine important relationships within this model.

The numbers in the diagram are an index to the ideas discussed below.
Australian public services exist within a broader system of public institutions and processes
Although our survey is focused exclusively on public services delivered by the Commonwealth, public trust in those services is unavoidably influenced by other things. It is influenced by both the reality and public perception of the interdependence of Australian public services with other public institutions, politics, the economy, culture and society as a whole. Some of those influential factors, such as demographic characteristics are measured in our survey. Others, such as political drivers are not. It is well known from international research that a range of factors matter for public trust, and that these influences will be reflected in our measurements. In the pages that follow, we go some way to differentiating factors which are within the Australian Government’s sphere of influence and those which are not, to get a better sense of what the Australian Government can do to build trust in Australian public services.
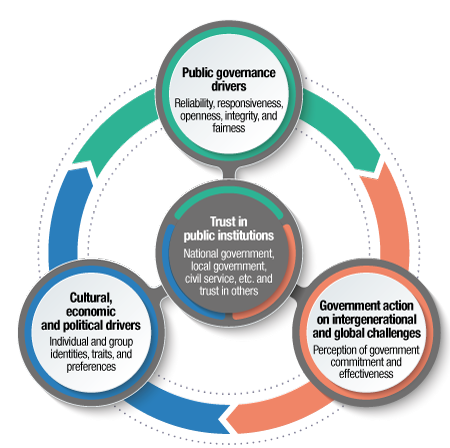
Ref: (European Foundation for the Improvement of Living and Working Conditions, 2018; Organisation for Economic Co-operation and Development (Ed.), 2017).
The OECD model for drivers of public trust in institutions acknowledge that culture, economy and political driver’s impact trust. According to recent studies the two most important determinants of citizens’ trust in public institutions is the quality of public services and the level of social tensions as perceived by the citizens. The large increase in trust during the COVID pandemic demonstrates how broader issues impact trust in public services. OECD (2017) Trust and Public Policy: How Better Governance Can Help Rebuild Public Trust. Available online: www.oecd.org | Image

|
Individual characteristics drive differences in trust
All people who access Australian public services do so from a different frame of reference. They have different:
- demographic characteristics (such as age, gender, location, education, income, culture… );
- life experiences that shape their trust in others and satisfaction with life generally; and
- life events in the last 12 months which led them to access Australian public services.
On the one hand, each of these characteristics has a unique association with the degree to which people trust Australian public services. We see for example that fewer women are likely to trust than men, and that more people who have education above year 12 are likely to trust than people who do not[14].
Each of these characteristics have relatively small associations with trust. However, there is also a pattern in these associations which is indicative of a broader influential trend. That is, trust is negatively associated with experiences of hardship, vulnerability, marginalisation and inequality. In our survey we see this most strongly through measures of psychological factors, such as respondent reports of feeling generally satisfied with life and feeling generally trusting towards other individuals.
This data highlights a fundamental aspect of trust. That is, the greater a person’s vulnerability, the higher the bar is for services to gain that person’s trust.
Proportion of Trust variablility attributable to other characteristics
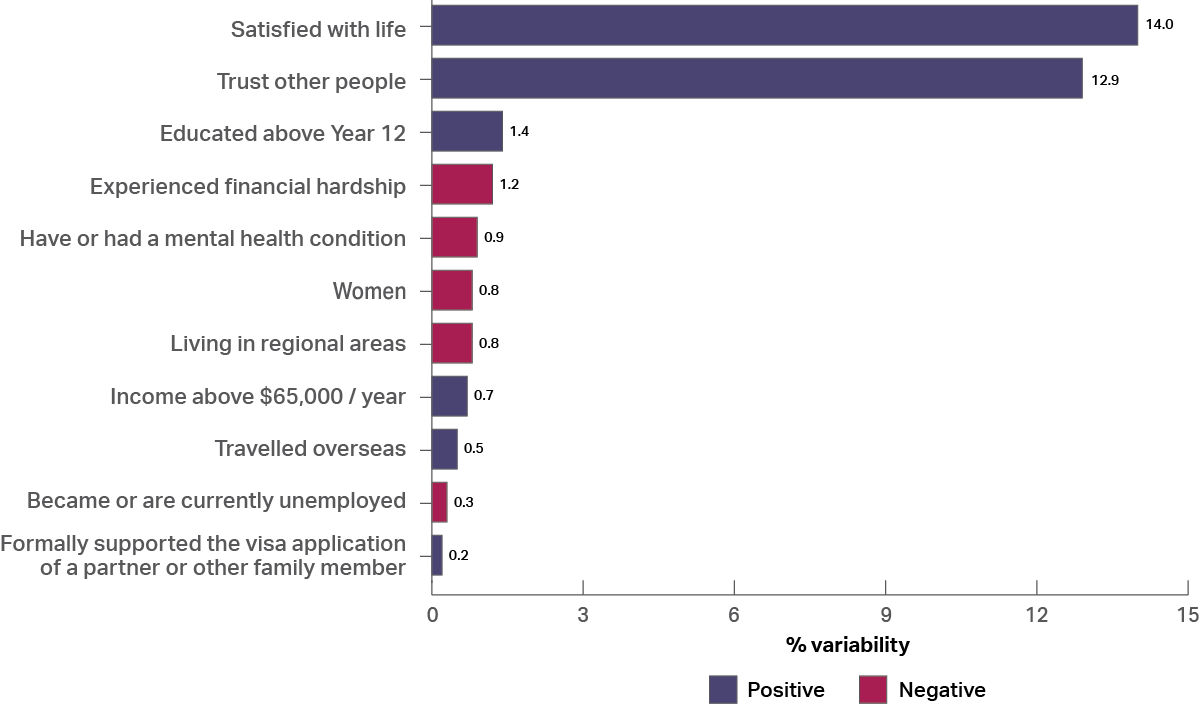
Trust - A psychological state comprising the intention to accept vulnerability based upon positive expectations of the intentions or behaviour of another. Rousseau, D. M., Sitkin, S. B., Burt, R. S. and Camerer, C. (1998) ‘Introduction to Special Topic Forum: Not so Different after All: A Cross-Discipline View of Trust’, Academy of Management, 23 (3): 393-404 | Image

|
Some events in life are more likely to lead to a person accessing services than others
Before asking people about accessing Australian public services, our survey asks people about significant events that have occurred in their lives in the last 12 months. We don’t ask people details about their service expectations, such as how long they thought it might take, but we make a reasonable assumption that the decision to access a service was based on an expectation the service would help meet their needs.
It’s often not possible to control the events which happen in your life, and some of them mean you are more likely to access services than others. For example, experiencing financial hardship is not something people seek out, but it happens to 27% of people in a 12-month period[15]. Of those, a quarter access services[16]. Similarly, disability is a reality for 15% of our respondents and 41% of those access Australian public services as a result.
Prevalence of life events
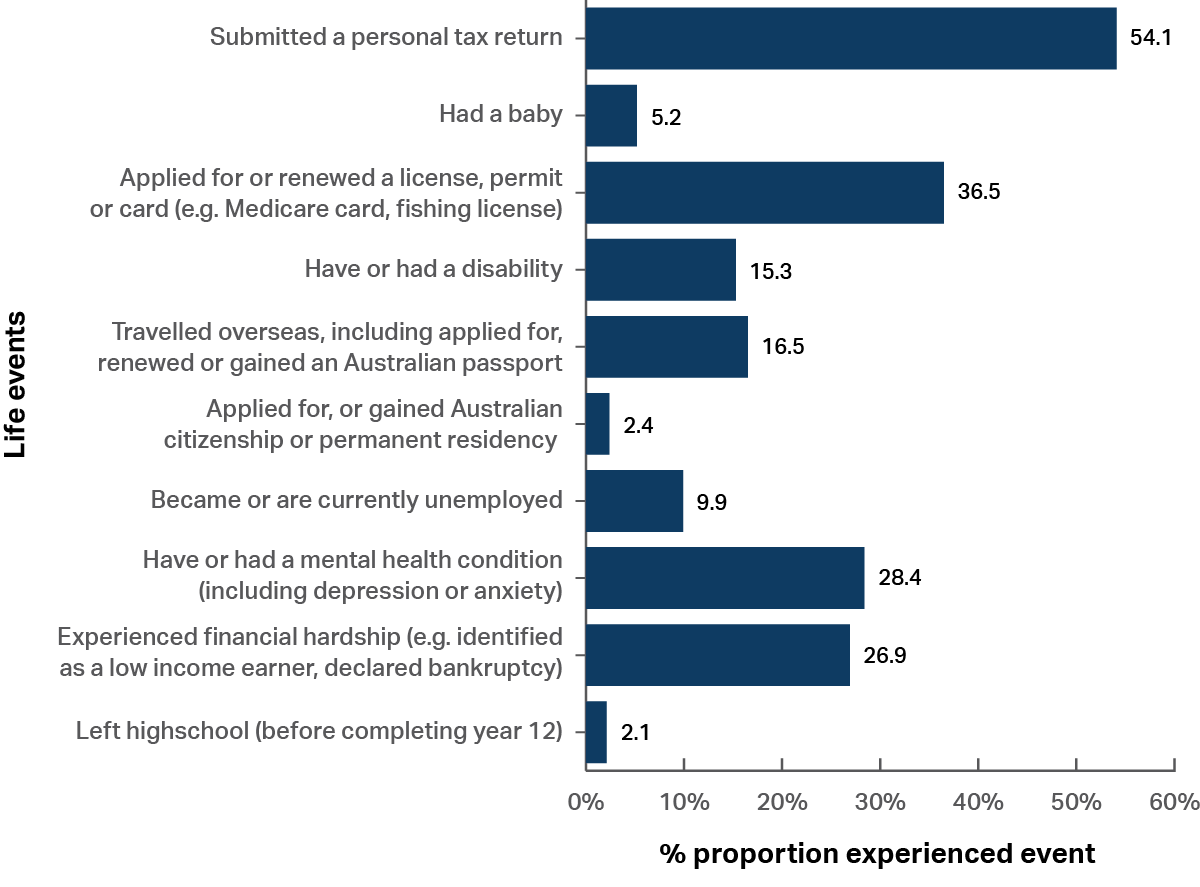
The proportion of people who accessed services following certain life events

Service access is associated not only with trust and distrust but also indifference
Of all respondents in our survey, 70% reported accessing Australian public services in the last 12 months[17].
Intuitively, one might expect greater rates of service access among people who trust than those who do not. However this is not the case. There is effectively no difference in the overall rate at which people access services between those who generally trust public services (72% accessed) and those who generally distrust public services (73% accessed). Although trust is driver of access, it is also correlated with two other important factors.
- People who are distrusting experience a greater number of life events (an average of 7.6 for distrusting people[18] compared to 6.7 for trusting people1), particularly negative ones, that might give reason for needing to access services (distrusting people access services for an average of 2.6 life events, compared to 2.3 for trusting people), and may have less discretion around accessing services. For example, as shown in the charts on the next page,[19][20] they are more likely to experience financial hardship and more likely to access services as a result.
- People who are trusting experience more positive life events and may have more discretion around what services they access. For example they are more likely to move back to Australia after living overseas, and more likely to access services as a result.
This pattern of results is a reminder that for some people, especially those who are more vulnerable, there are fewer options to turn to for help. Disadvantaged Australians disproportionately rely on public services for help.
| Service access is lowest among people who report neither trusting nor distrusting public services (63%). Presumably, people who haven’t accessed services recently are more likely to feel indifferent about them. | Image

|
Proportion of people who experienced a specific life event
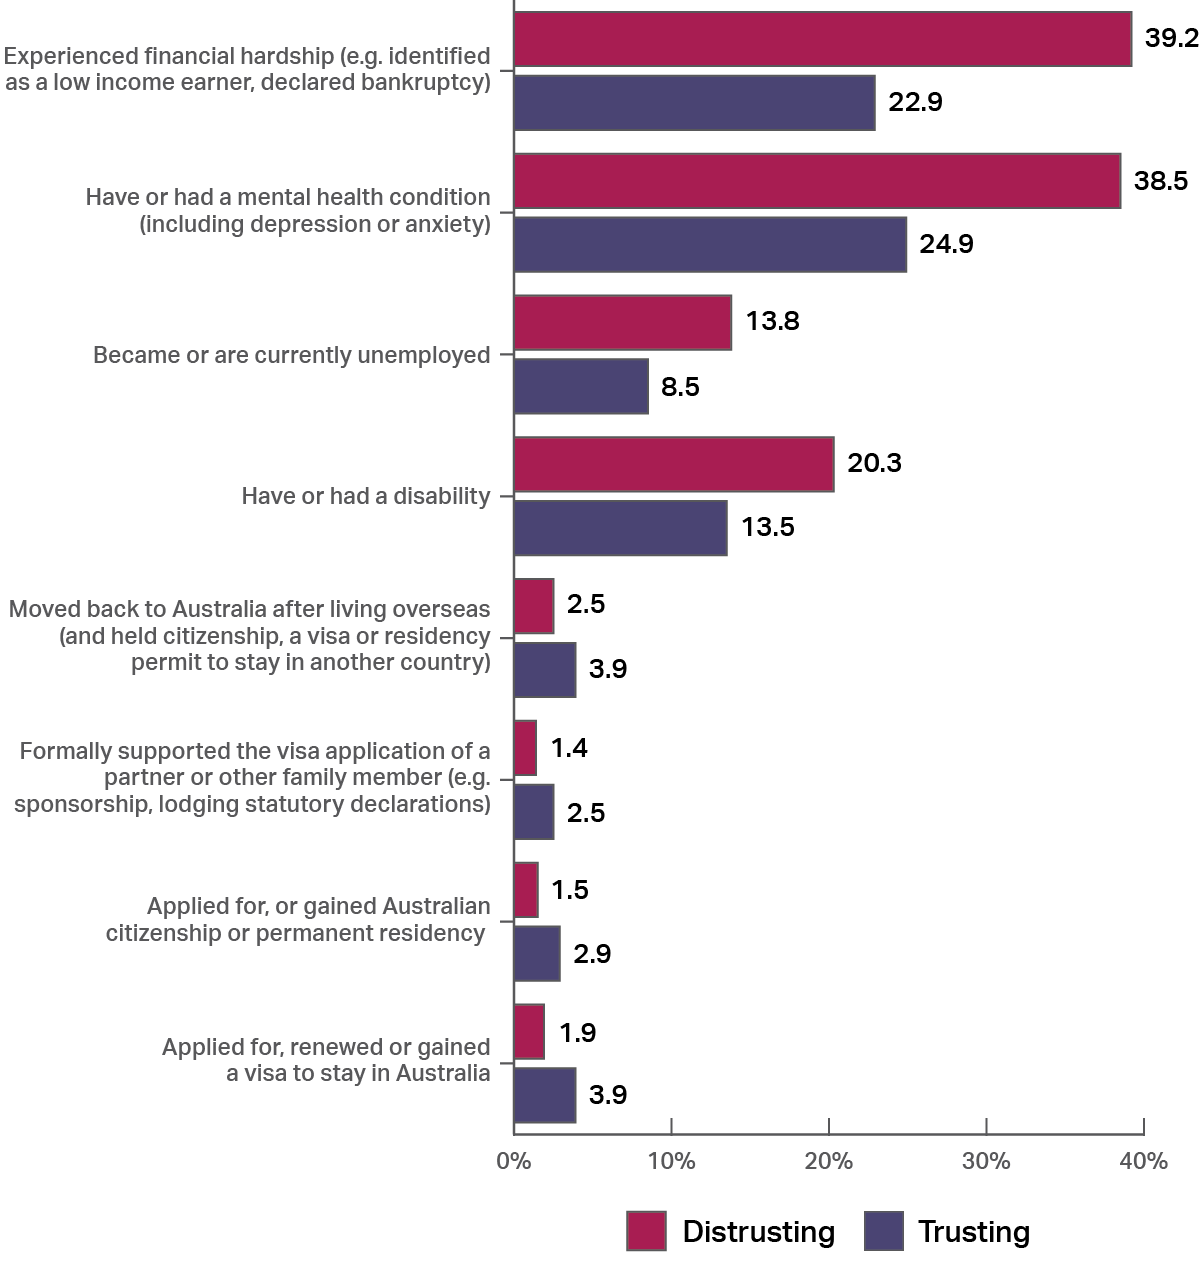
Proportion of people who accessed services for a life event after experiencing it
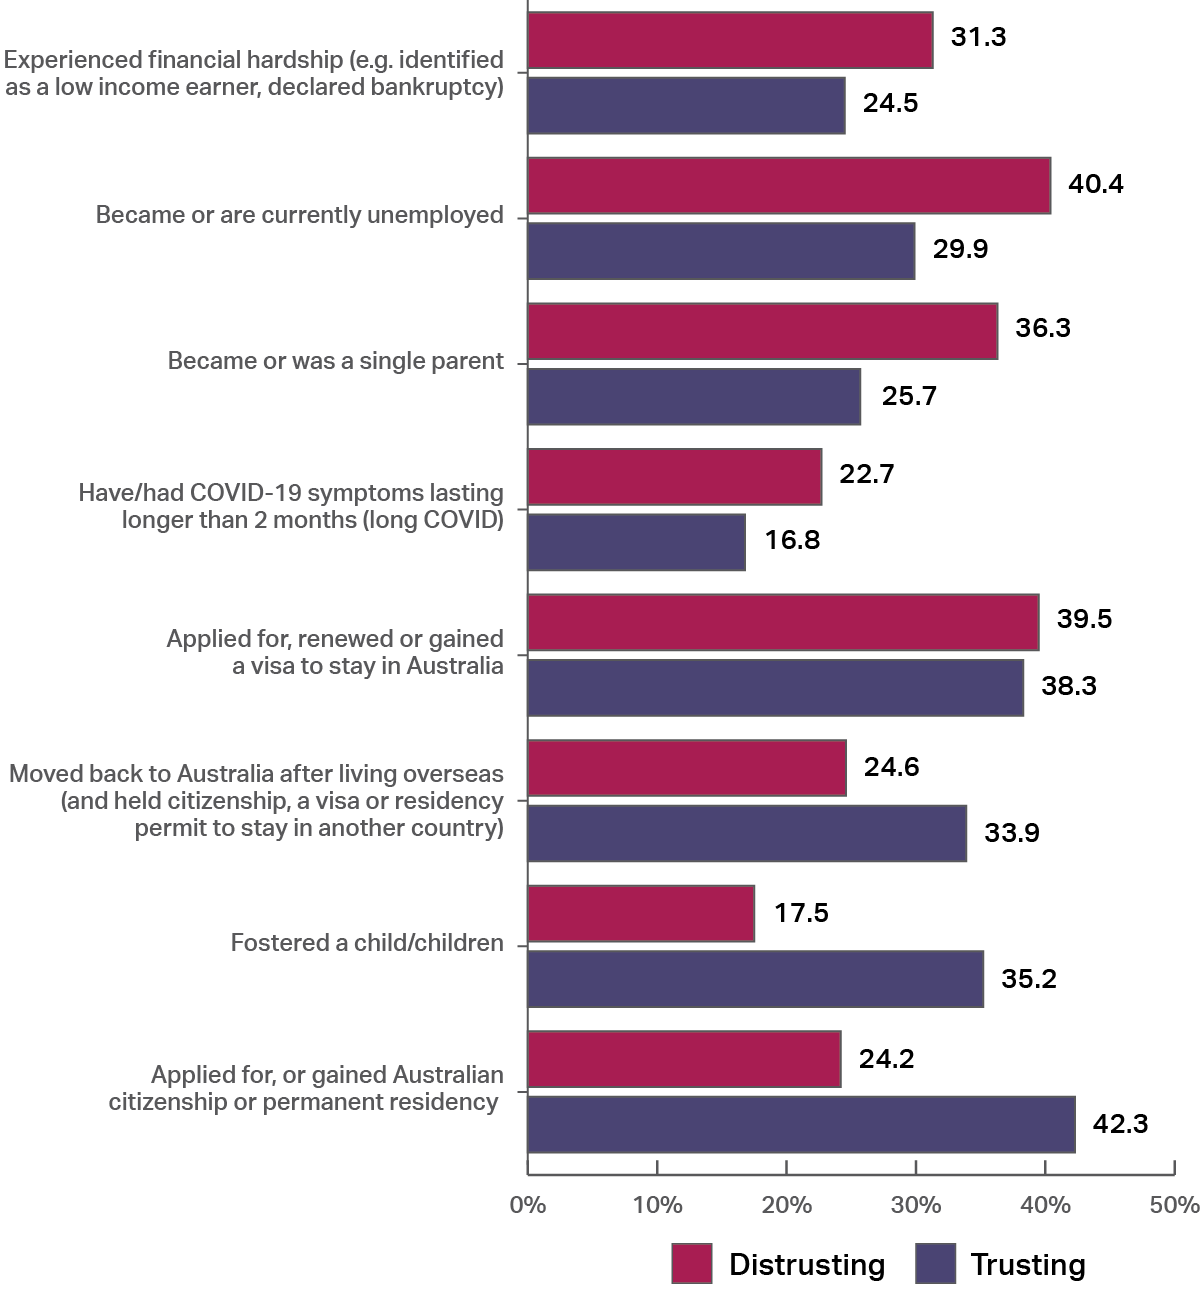
Trusting is the group of people who indicated that they trust public services, distrusting is the group of people who indicated that they distrusted public services. See footnotes [20] and [18]
Only those who access services can be dis/satisfied with them
Our headline results comprise an overall measure of trust and of satisfaction. It is important to note that these numbers are derived from different groups of people. The trust figure[21] (61%) includes a response from everyone we surveyed, whereas the satisfaction figure[22] (72%) only relates to people who accessed services.
Among those who accessed services, the most commonly cited purpose was for financial reasons: applying for assistance and/or receiving assistance (30%) and compliance and registrations (30%). Other reasons include applying for but not receiving assistance (5%), non-financial reasons such as seeking information or training (such as an apprenticeship) (15%); and civic participation (5%)[23].
Among those who did not access services, the most commonly cited reason was not having a need to access services (41%). Other reasons include not being aware of what services they could access (24%), the system being too hard to access support (6%), not wanting to access support (4%) and using alternative means of support (6%)[24].
Continuing the trust-focused analysis of these factors, we observe a higher percentage of people accessing services for financial reasons among distrusting individuals[18] (42%) than trusting individuals[21] (33%). Trusting individuals were more likely to access for compliance or registration (33% vs 26%).
When asked why they didn’t access public services, trusting individuals[21] were more likely to answer that they didn’t need them (49% as compared to 32%), or that they used alternative means of support (6% vs 4%), whereas distrusting individuals[18] were more likely to say they weren’t aware of the public services (29% vs 21%) or that they system was too hard to access support (14% vs 3%).
Taken together, we can see that distrusting individuals tended to need public services but could not get them due to difficulties in the system, or were not able to access financial assistance, compared to trusting people who either had other means of support, received assistance or were accessing services for compliance or registration.
| Trusting people were 17 percentage points more likely to report not needing Australian public services. Taken with a broader pattern of results, this indicates they had alternative options or were not in a vulnerable situation where they required support. | Image

|
People want services that are easy to use and give them what they are after
Satisfaction is affected by a number of factors including those related to the experience people have with services, as well as people’s expectation of the kind of help services will provide. The survey asks respondents to rate the services they accessed on 17 of these factors and the ones most strongly associated [25] with changes in overall satisfaction with Australian public services are:
| Image

|
The full list of 17 factors is available in Section 1.
Services compare differently when taking drivers of trust and satisfaction in to account
In this section of the report, we have so far noted that independent characteristics of individuals such as life satisfaction and general trust in others have strong correlations with general trust in Australian public services, and that trust is in turn associated with what services they access and why. The impact of this association carries all the way through to satisfaction and trust ratings of individual services. That is, some services receive higher or lower ratings in part because of the composition of people they provide services for. Services who look after a greater proportion of more vulnerable individuals have a higher bar for satisfying and gaining the trust of their customers. By statistically controlling for some of these differences, we can estimate how they affect trust and satisfaction ratings in individual services.
This chart shows satisfaction in each service, adjusted to show an estimate of what it would be if each service had all customers with the same average scores for life satisfaction and interpersonal trust. Services such as Centrelink would be expected to have a satisfaction rating 3 percentage points higher (66% vs 63%) while DFAT would be 4 percentage points lower (72% vs 76%)[26].
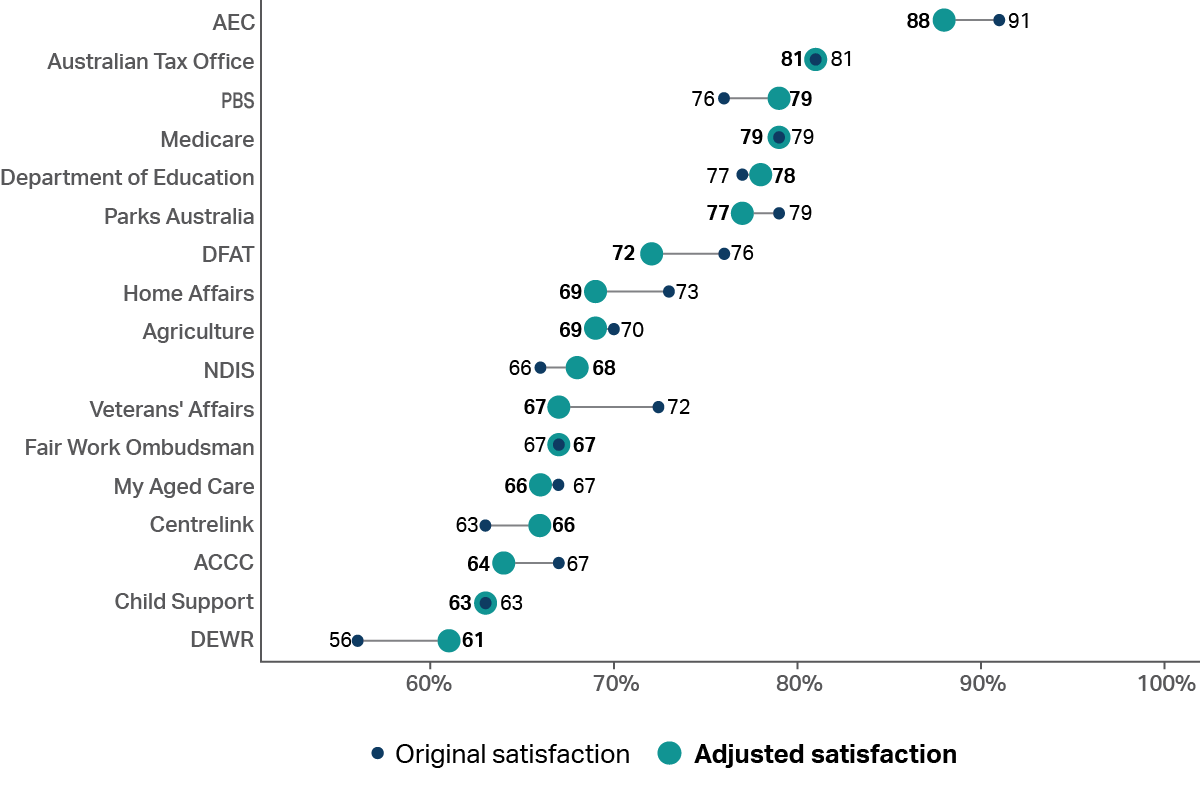
Satisfaction is adjusted to show what satisfaction for each service would be if each service had a group of people with the same life satisfaction and trust in other people accessing them. Further information is available in note [26] of the footnotes.
Trust and satisfaction: both a positive and negative feedback loop
When people are satisfied with the services they receive, it builds their trust. When people are trusting, there is more institutional legitimacy and compliance with public services. When people interact with services this way, they are more likely to have satisfactory experiences. Interactions like this have the potential to feedback positively on each other in a virtuous cycle increasing trust and satisfaction over time. It can also work the other way around in a vicious cycle or negative feedback loop. Some people have such distrust and dissatisfaction with government that they would decline to even participate in the survey.

The bar keeps rising as expectations keep rising
What should we be aiming for? What should be the benchmark by which services know what they are achieving is good?
Optimistically, one might say 100 per cent trust and satisfaction. By definition, this would be ideal. But realistically we can expect to continue to see numbers below this for two broad reasons.
One, as long as there are inequalities and imperfections in society, the economy and public institutions generally, then for all the reasons we have outlined so far in this section of the report, trust and satisfaction in public services will always be below one hundred.
Two, the bar is set by the expectations public services create for themselves. Improvements to public services generate satisfaction temporarily until this becomes the new normal and the standard by which people set their expectations in future. The standard is also set by expectations stemming from other sources, such as experiences of services delivered by the private sector.
Countries delivering similar services, to similar populations, in similarly designed public systems can provide a useful point of comparison, as we have shown in the headline section. Unfortunately, few countries collect and public publish data at a service delivery level providing for such a meaningful comparison.
There are other ways to draw comparisons and ways to benchmark performance. One that should act as the default for any service, is the comparison against itself historically. Desirably, services will increase their trust and satisfaction ratings over time. However, it is entirely reasonable to be satisfied with maintaining the same level. This means a service is keeping pace with rising expectations.
In the third section of this report, we provide service level data regarding trust and satisfaction, enabling services to gain an understanding of how they have been tracking over last five years (where possible).
Footnotes
[14] A linear regression model was used with Trust as a binary outcome variable (Strongly Agree, Agree, or Somewhat Agree with the statement “I can trust Australian public Services is 1, all other answers 0) and the other characteristic in the graph as a predictor variable.
[15] Q9 - The proportion of people who said they experienced the life event in the last 12 months.
[16] Q9 & Q11 - The proportion of people who experienced the life event in the last 12 months who said they accessed services for that event.
[17] Q9 & Q11 - The proportion of people who indicated they accessed a service for any life event.
[18] Q18 - General distrust is the proportion of people who answered “strongly disagree”, “disagree” or “somewhat disagree” when asked “How much do you agree with the following statement - ‘I can trust Australian public services’”.
[19] Q18 & Q9 - The proportion of people in each trust group who indicated they experienced the shown life event.
[20] Q18, Q9 & Q11 - The proportion of people in each trust group who once they had experienced a life event, then accessed services for that life event.
[21] Q18 - General trust is the proportion of people who answered “strongly agree”, “agree” or “somewhat agree” when asked “How much do you agree with the following statement - ‘I can trust Australian public services’”.
[22] Q20 - Satisfaction is the proportion of people who answered “Completely satisfied”, “Satisfied” or “Somewhat satisfied” when asked “Thinking about your overall experience with the above services, how satisfied or dissatisfied are you?”
[23] Q11c - The proportion of people who accessed services who indicated the reason was the primary reason they accessed services.
[24] Q11b - The proportion of people who did not access services who indicated the reason was the primary reason they did not access services.
[25] A linear regression with a satisfaction binary (Completely Satisfied, Satisfied, Somewhat Satisfied as 1, all other answers 0) as the outcome variable and a trust binary (Strongly Agree, Agree, or Somewhat Agree with the statement “I can trust Australian public Services is 1, all other answers 0) as the predictor variable was run. Further linear regressions were then run with each of the factors added individually as a further binary predictor variable (Completely Agree, Agree, or Somewhat Agree with each factor as 1, all other answers as 0). A log likelihood analysis was run between each of these further regressions and the original regression to determine which factors were most associated with changes in satisfaction.
[26] A linear regression with binary specific service satisfaction (people who answered “Completely satisfied”, “Satisfied” or “Somewhat Satisfied” when asked how satisfied or dissatisfied they were with a specific service as 1) as the outcome variable and Life Trust (People who answered “Strongly Agree”, “Agree” or “Somewhat Agree” to the question “Most people can be trusted” as 1) and Life Satisfaction (people who answered “Completely Satisfied”, “Satisfied” or “Somewhat Satisfied” to the question “Overall how satisfied or dissatisfied are you with life as a whole these days?” as 1) as predictor variables. Each service’s satisfaction was then adjusted to what it would be if they had the same Life Satisfaction and Life Trust as the median service (Medicare).
