[toc]
Who trusts?
Image
| Life Satisfaction | Image
| Gender | Image
| Regional and Metro areas | ||
| 71% of people who were satisfied with life[8] reported trust in public services[1], compared with 36% of people who were dissatisfied with life. | 63% of men reported trust in public services compared to 53% of women. | More people who live in Metro areas reported trust in public services (60%) than people who live in regional areas (53%). | |||||
Image
| Income | Image
| Language spoken at home | Image
| Trust in people | ||
| 65% of those earning above a weekly wage of $1,249 reported trust in public services compared to 59% of people earning less than $1,250 weekly. | 76% of people who primarily speak a language other than English at home reported trust in Australian public services, compared to 57% who primarily speak English at home. | 75% of people who trusted others[9] also reported trust in public services, compared with 38% for those who distrusted others. | |||||
Image
| Age | Image
| Education levels | Image
| Country of birth | ||
| Trust in public services was higher for people aged 18-34 (61%) and 65+ (60%) than those aged 35-64 (55%). | 60% of those who graduated year 12 reported trust in public services compared to 49% of people who left education before year 12. | 65% of people born in a country other than Australia reported trust in Australian public services compared with 56% people born in Australia. | |||||
What aspects of services were people satisfied with?
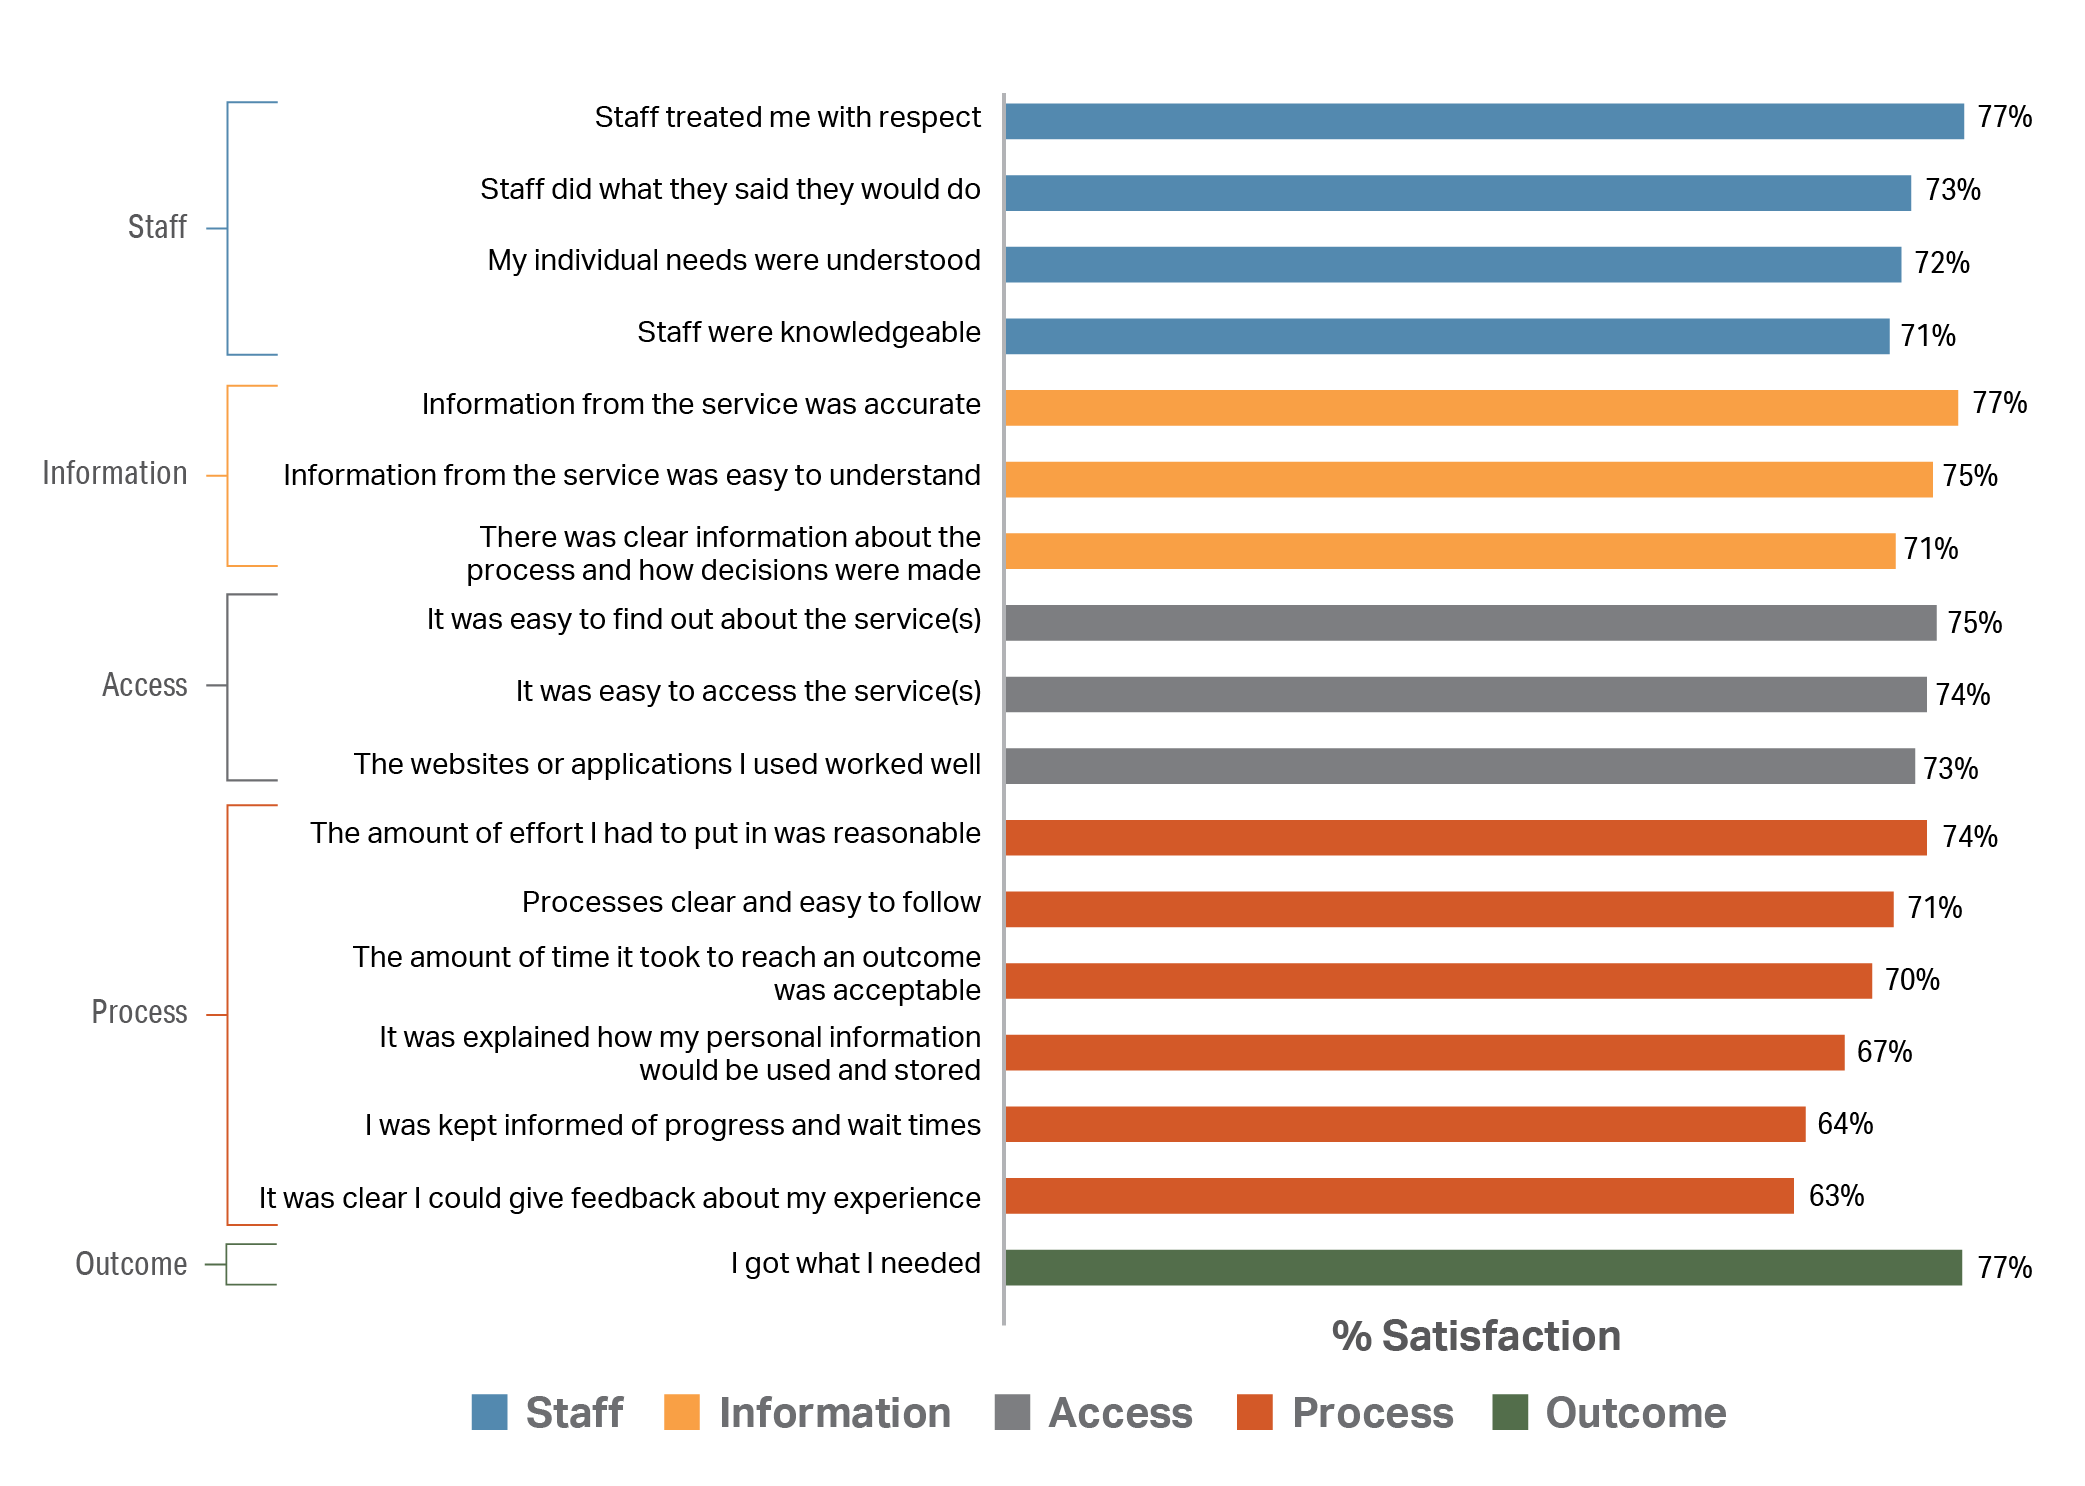
In 2024, people were most satisfied[5] with:
- their respectful interactions with staff
- the accuracy of information provided.
People were least satisfied[6] with elements of service processes, such as:
- being kept informed of progress and wait times
- the amount of time it took to reach an outcome
- clarity that they could give feedback about their experience.
77% of people indicated that they got what they needed. This represents one of the strongest satisfaction elements.
Figure 2: Proportion of people who were satisfied with the service
What aspects of services were people dissatisfied with?
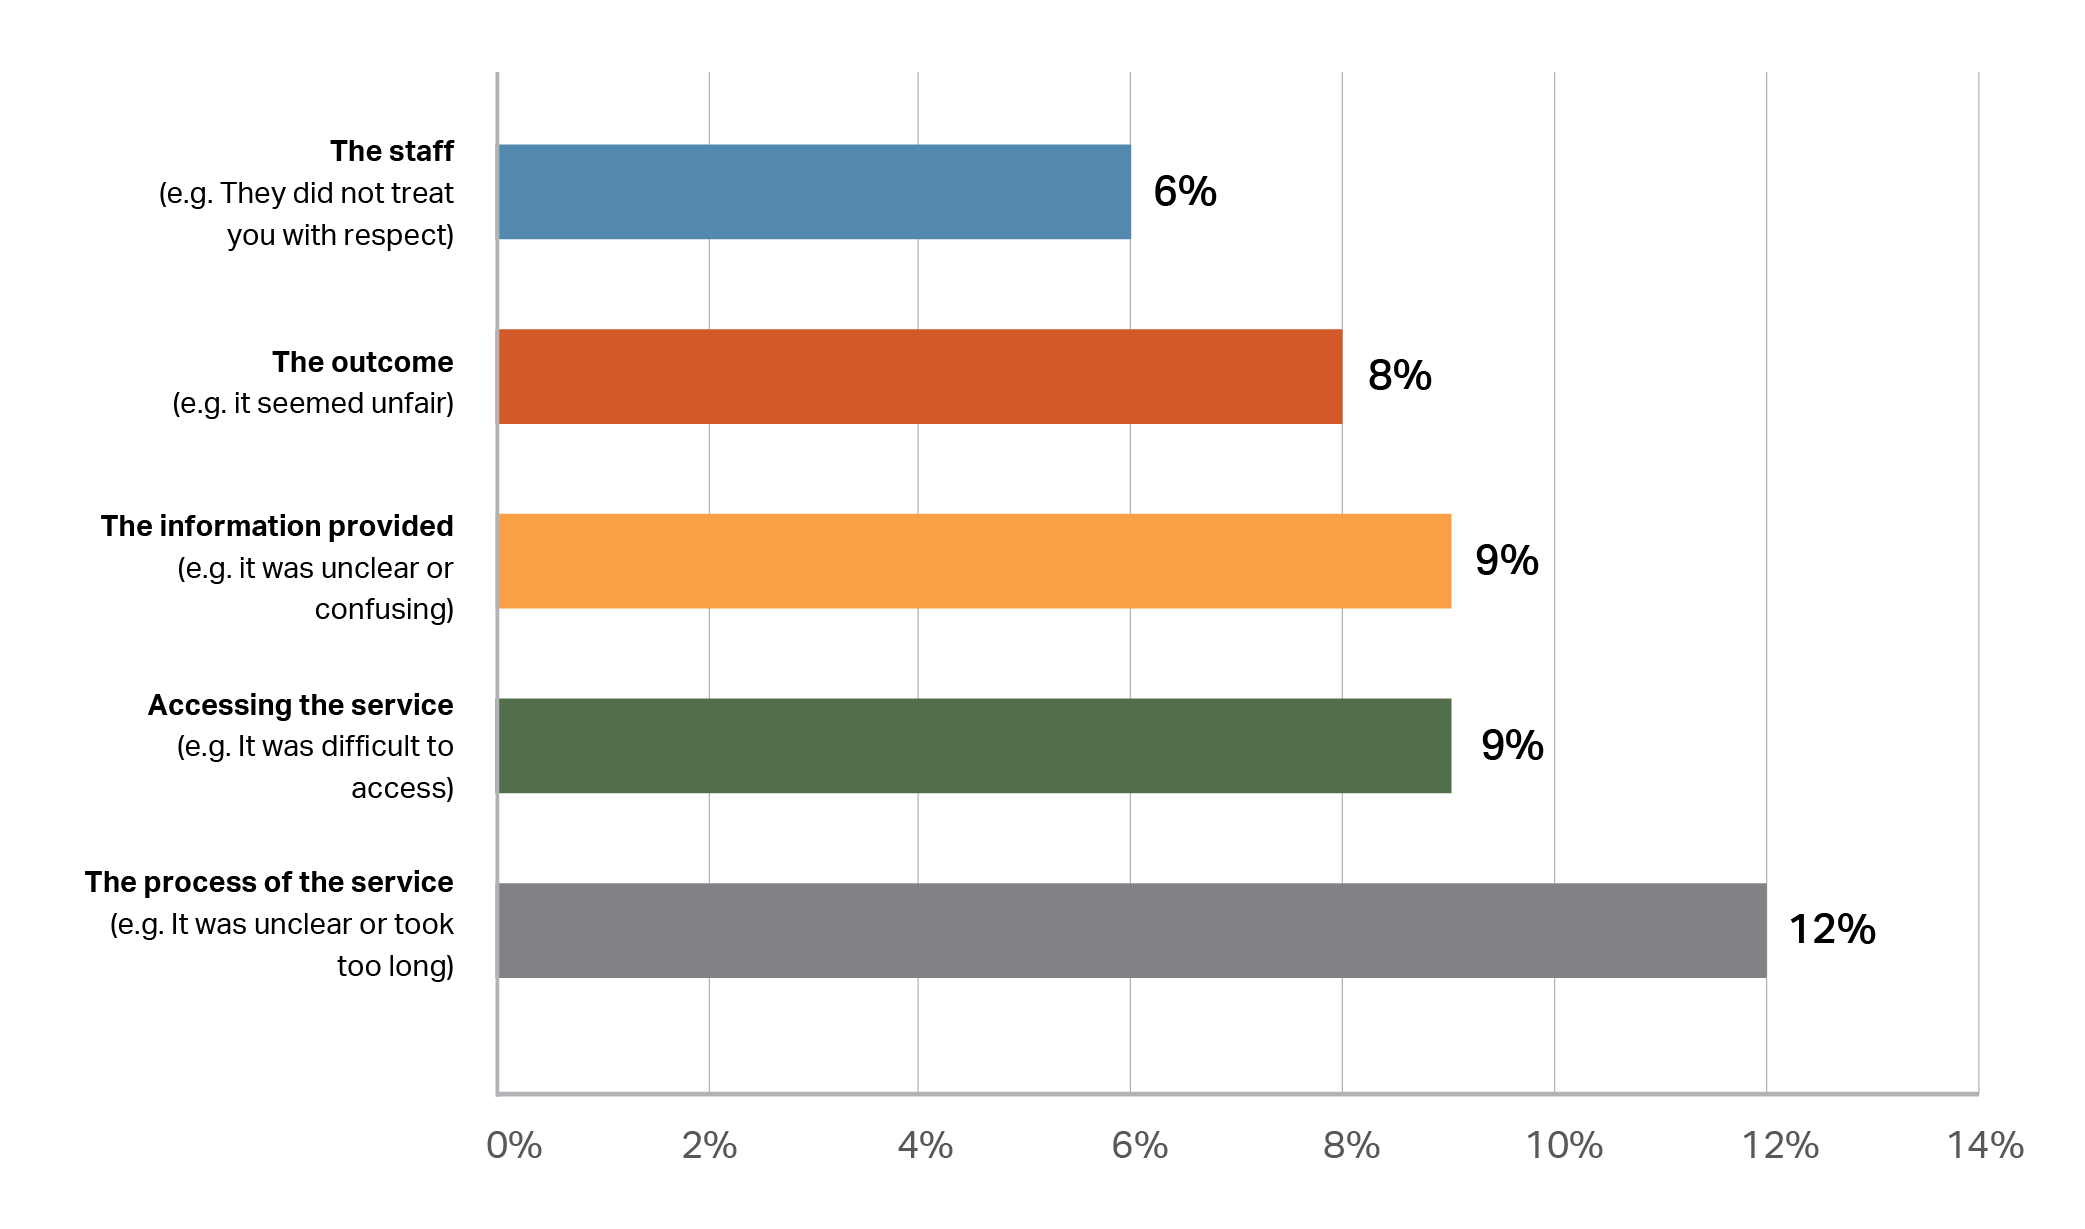
One in five people who accessed services reported dissatisfaction with at least one of these service[10]. We followed these people up with a question that asked which aspect of the service they were most dissatisfied with[11].12% of people reported their dissatisfaction related to the process, and 9% said that it was related to access.
Figure 3: Reasons for dissatisfaction
Trust and satisfaction in specific services
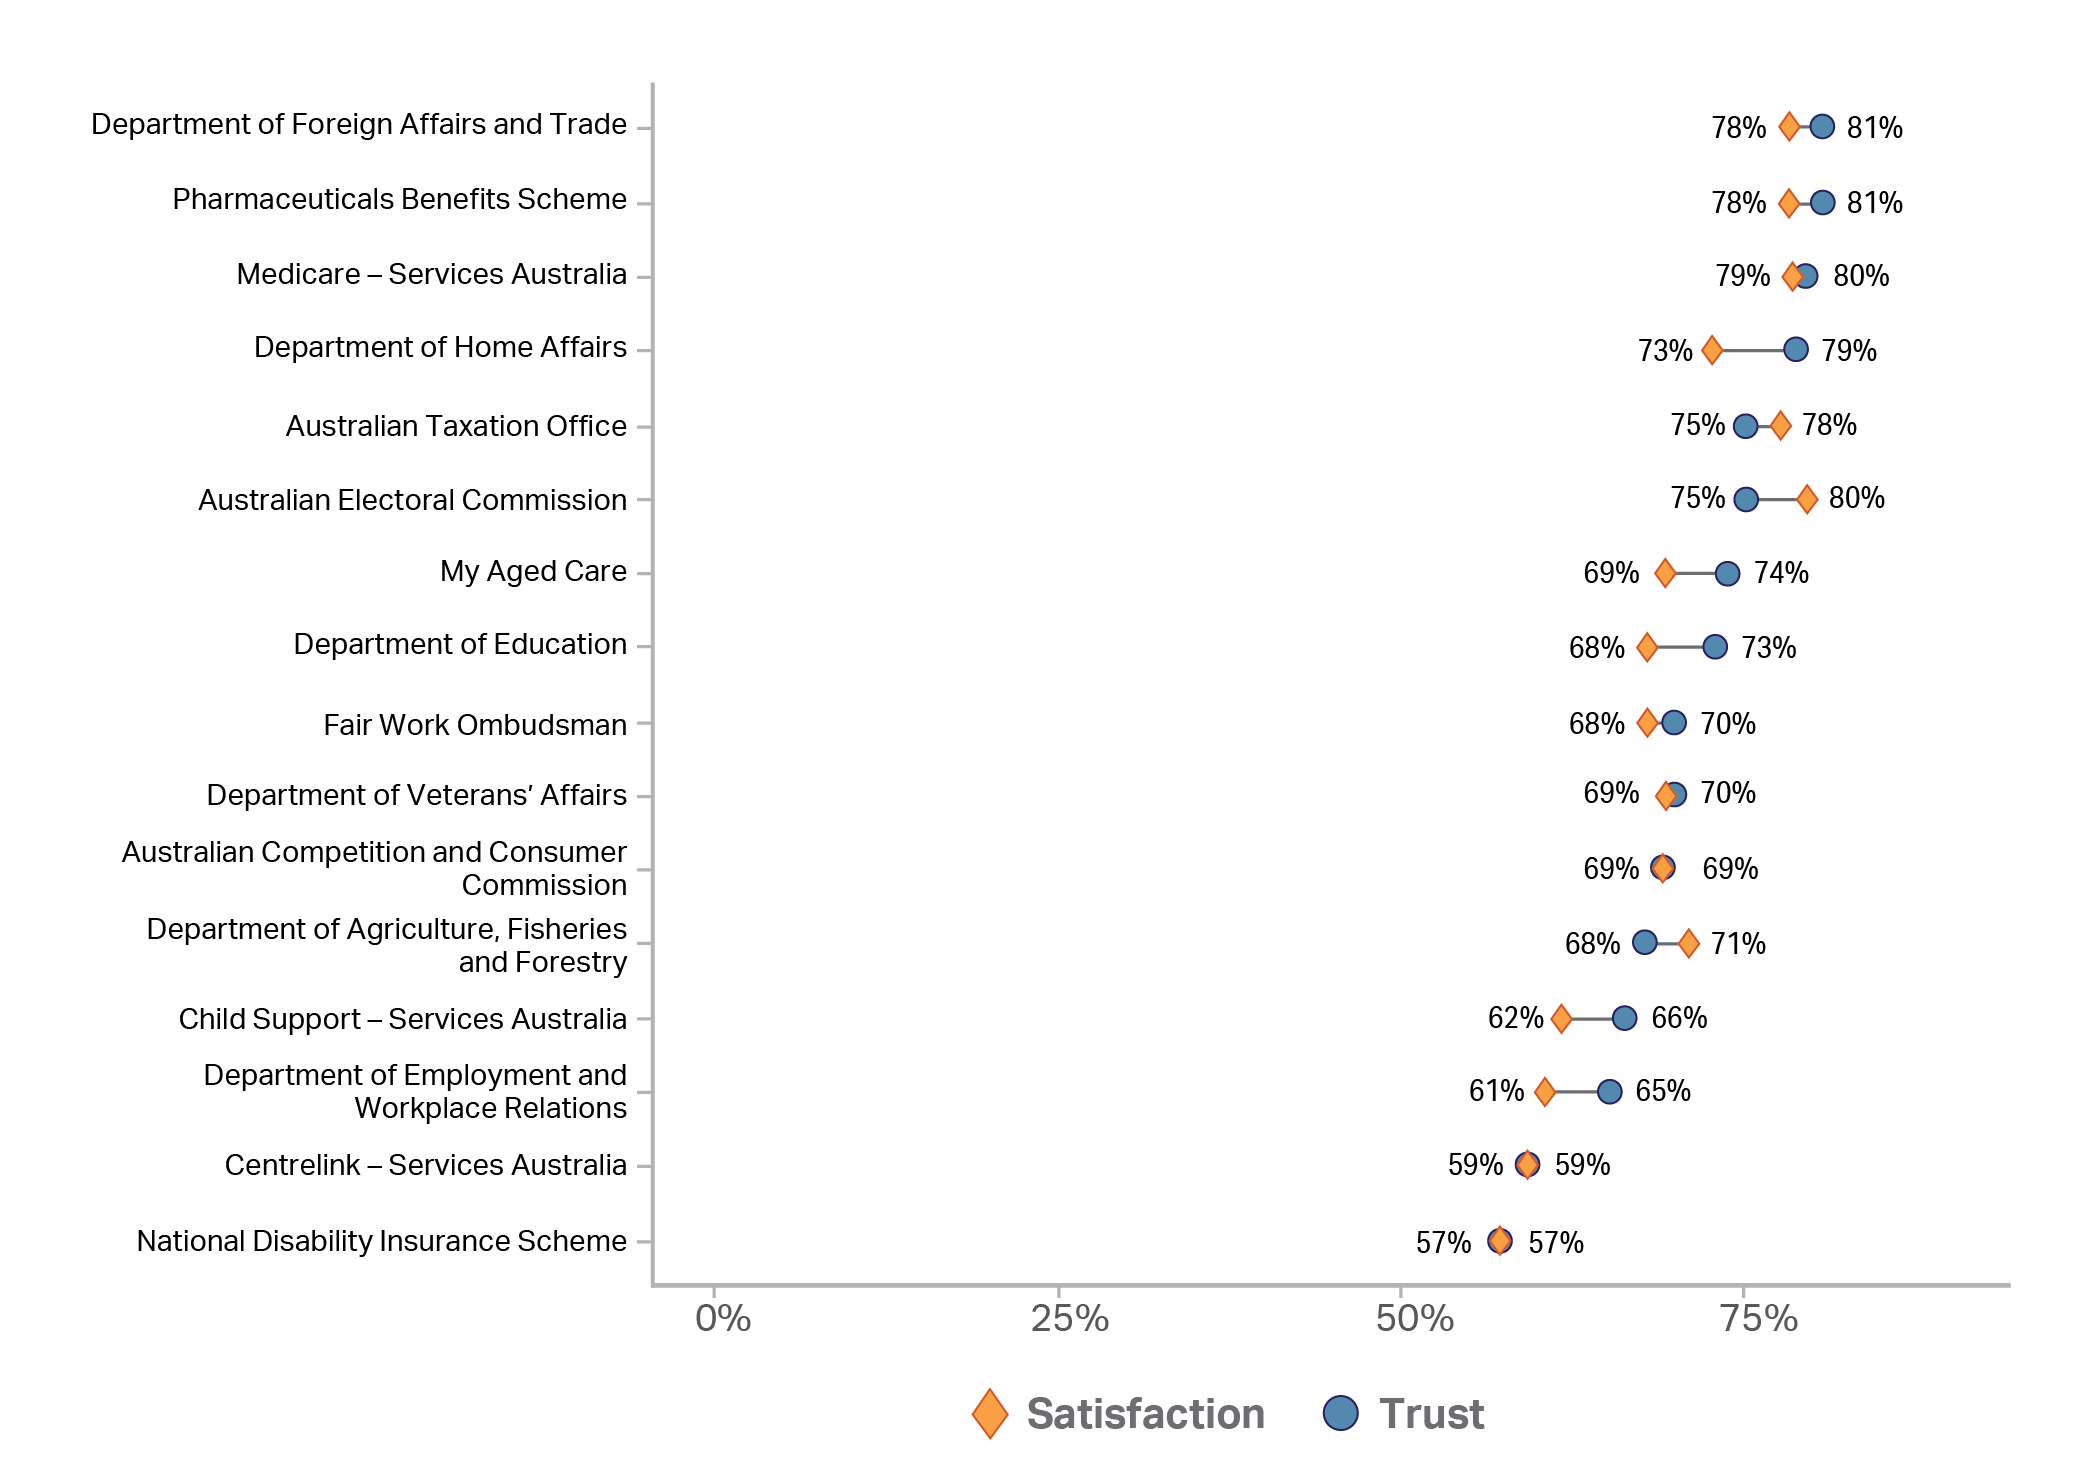
Figure 4: Service Trust and Satisfaction
Want more detail on services? More results for each service are available online through our interactive dashboard. | Image
|
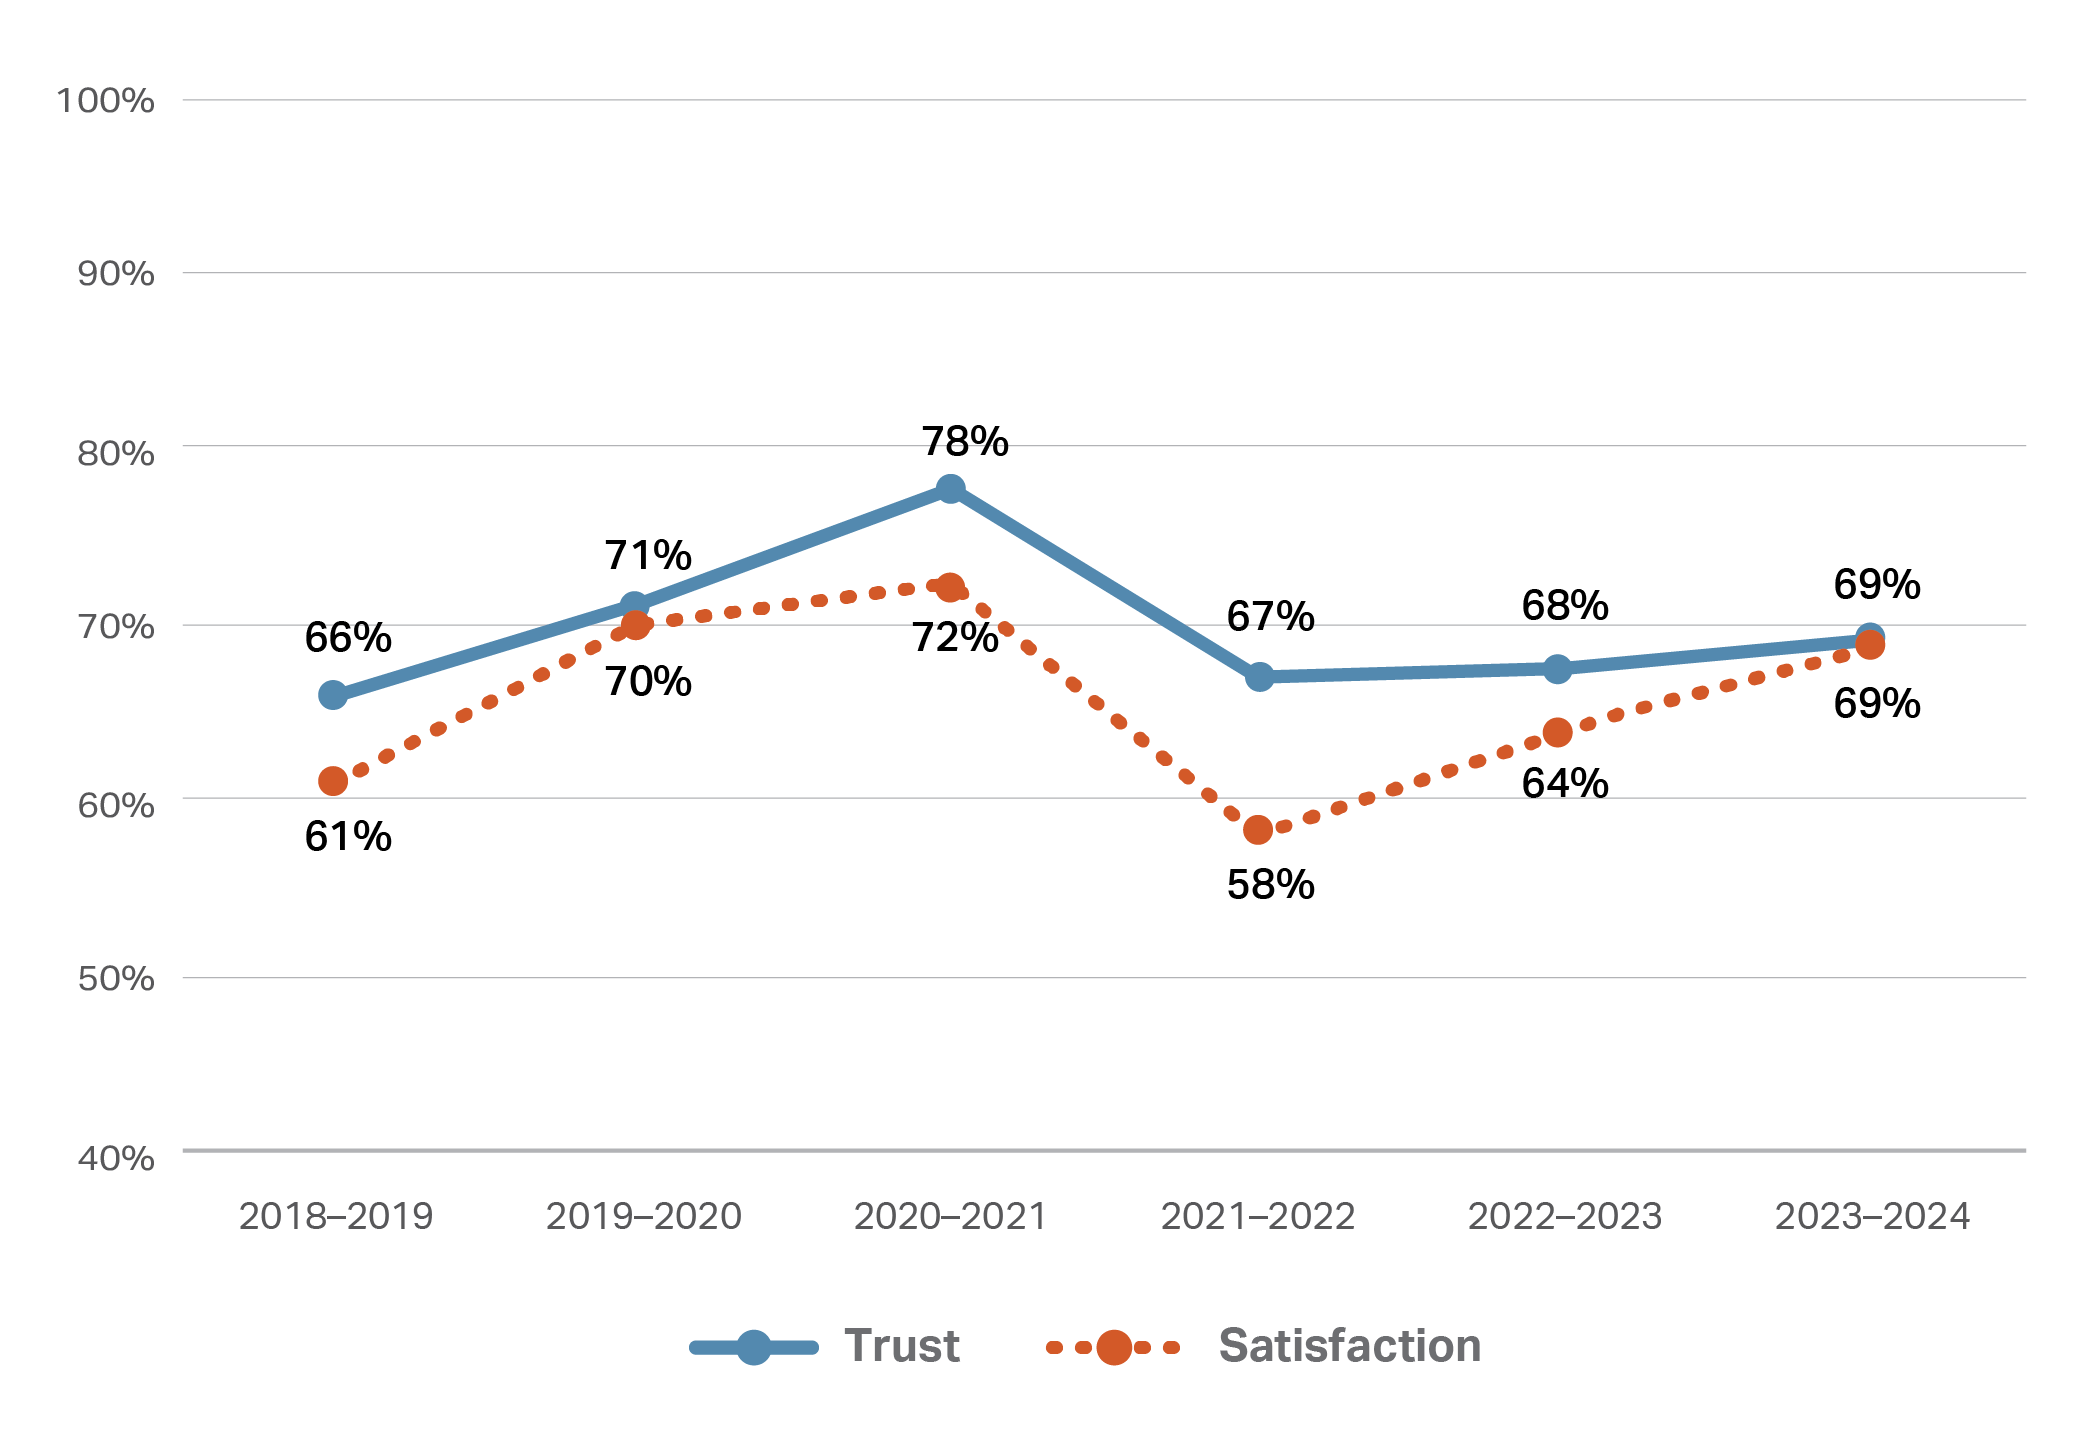
Trust and satisfaction in each service over time
Australian Competition and Consumer Commission
Australian Electoral Commission
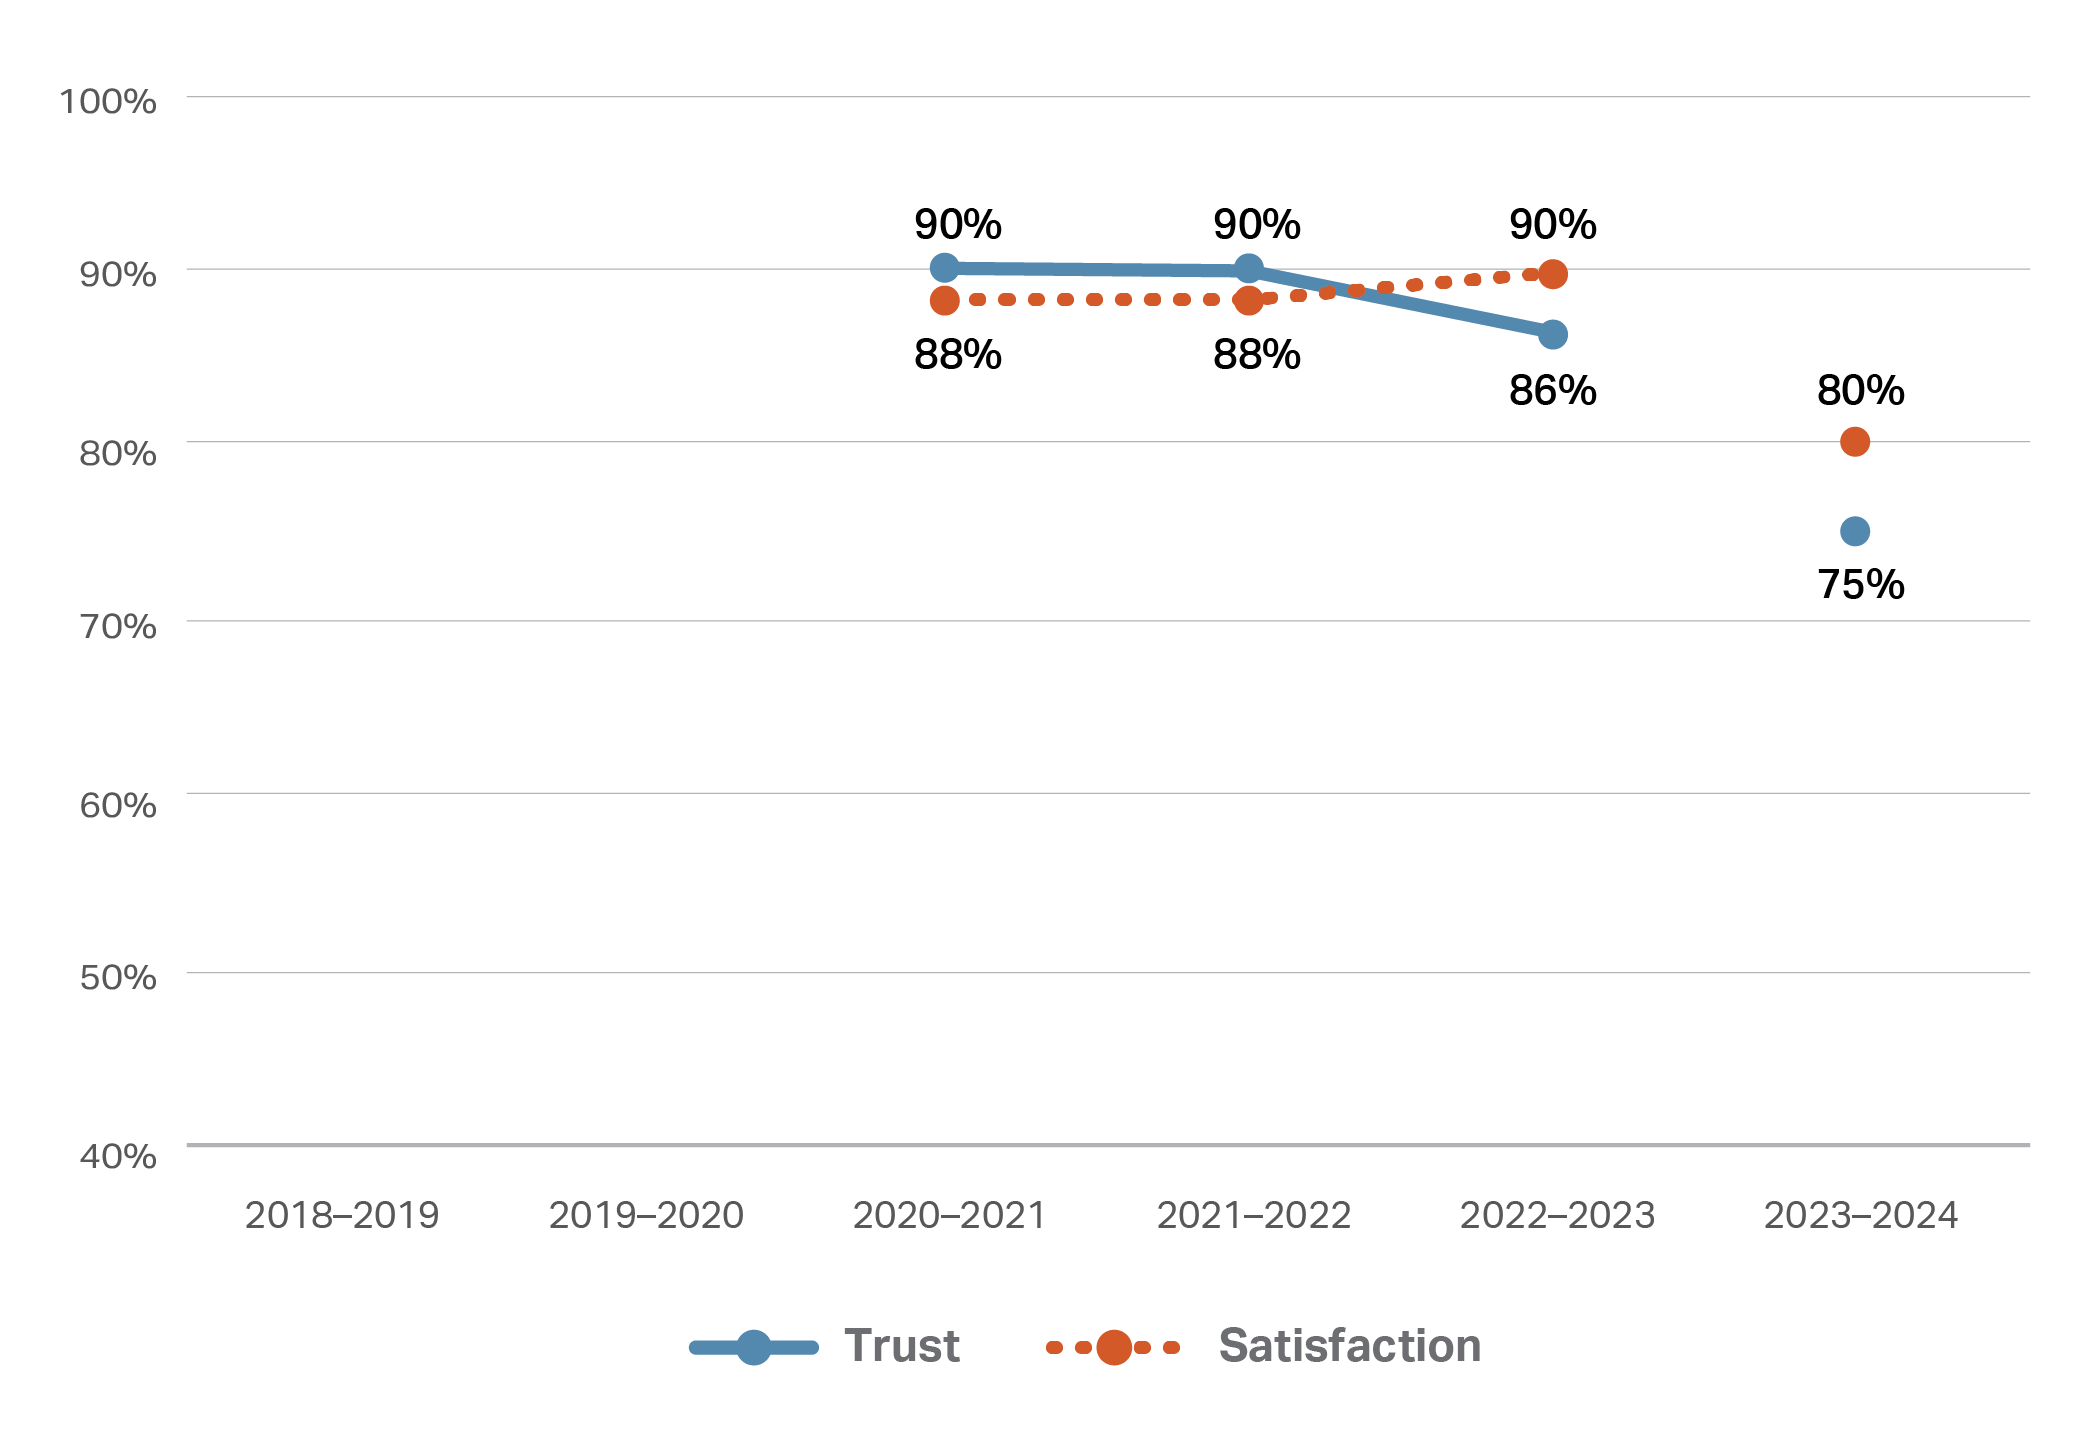
Note: A method change affected findings for the Australian Electoral Commission in the 2023-2024 financial year. The change led to over 20 times as many people answering questions about the service. This resulted in reported trust and satisfaction for the agency becoming much more neutral. As such, the current year findings are not directly comparable to previous years. More details about the method changes can be found in Appendix and Supplementary Material. |
Australian Taxation Office
Centrelink – Services Australia
Child Support – Services Australia
Department of Agriculture, Fisheries and Forestry
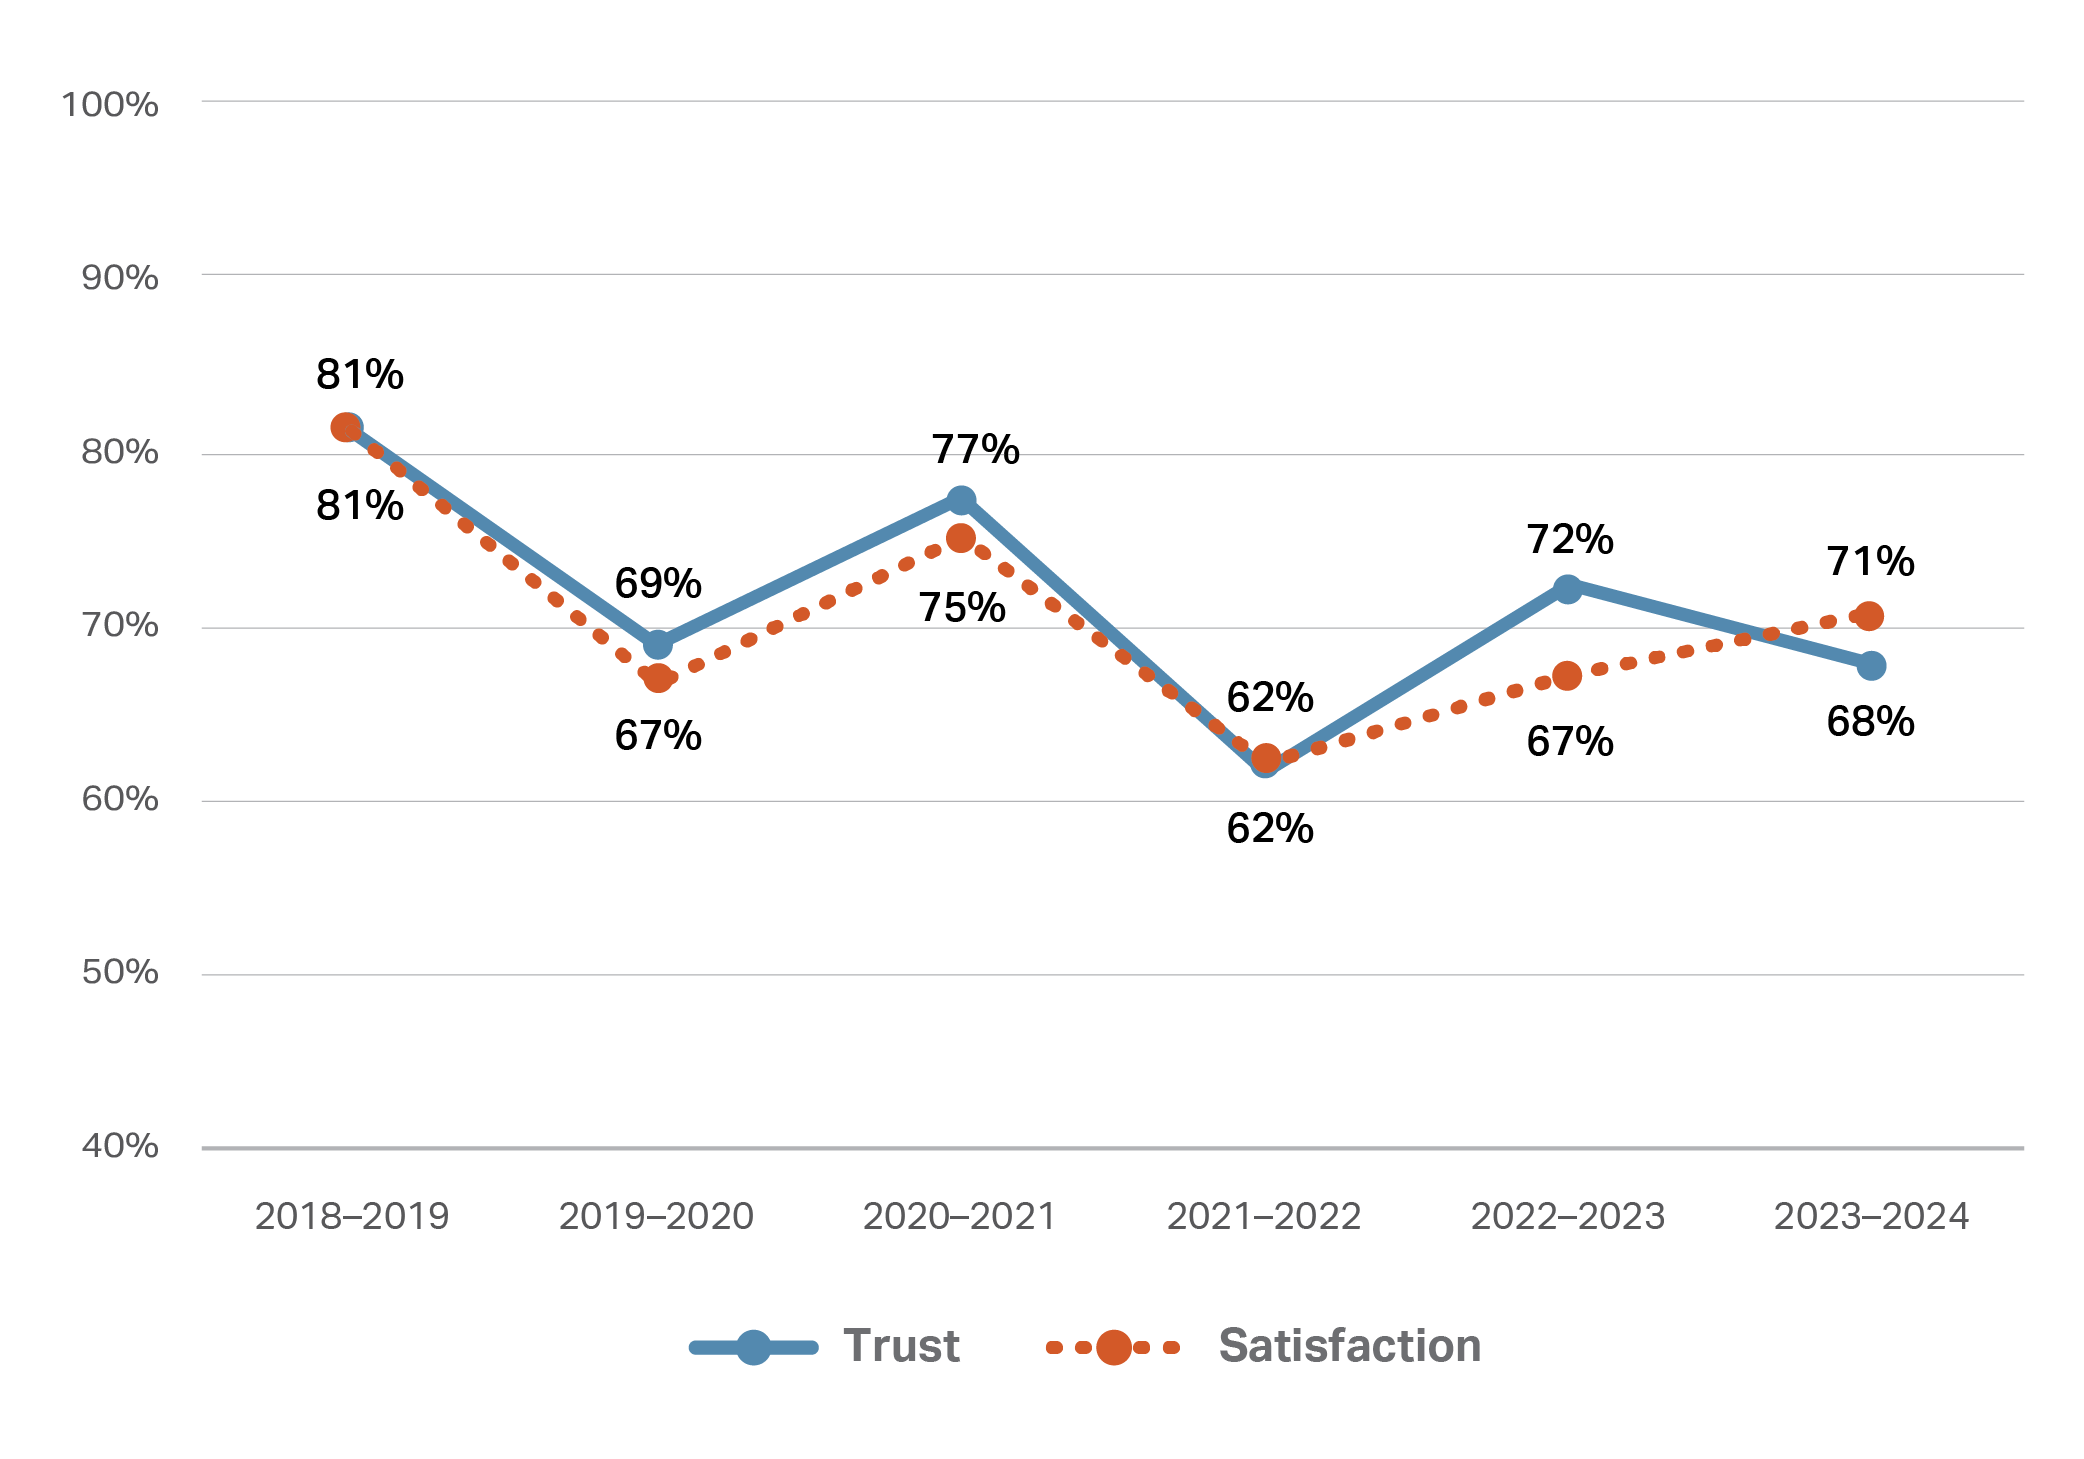
Department of Education
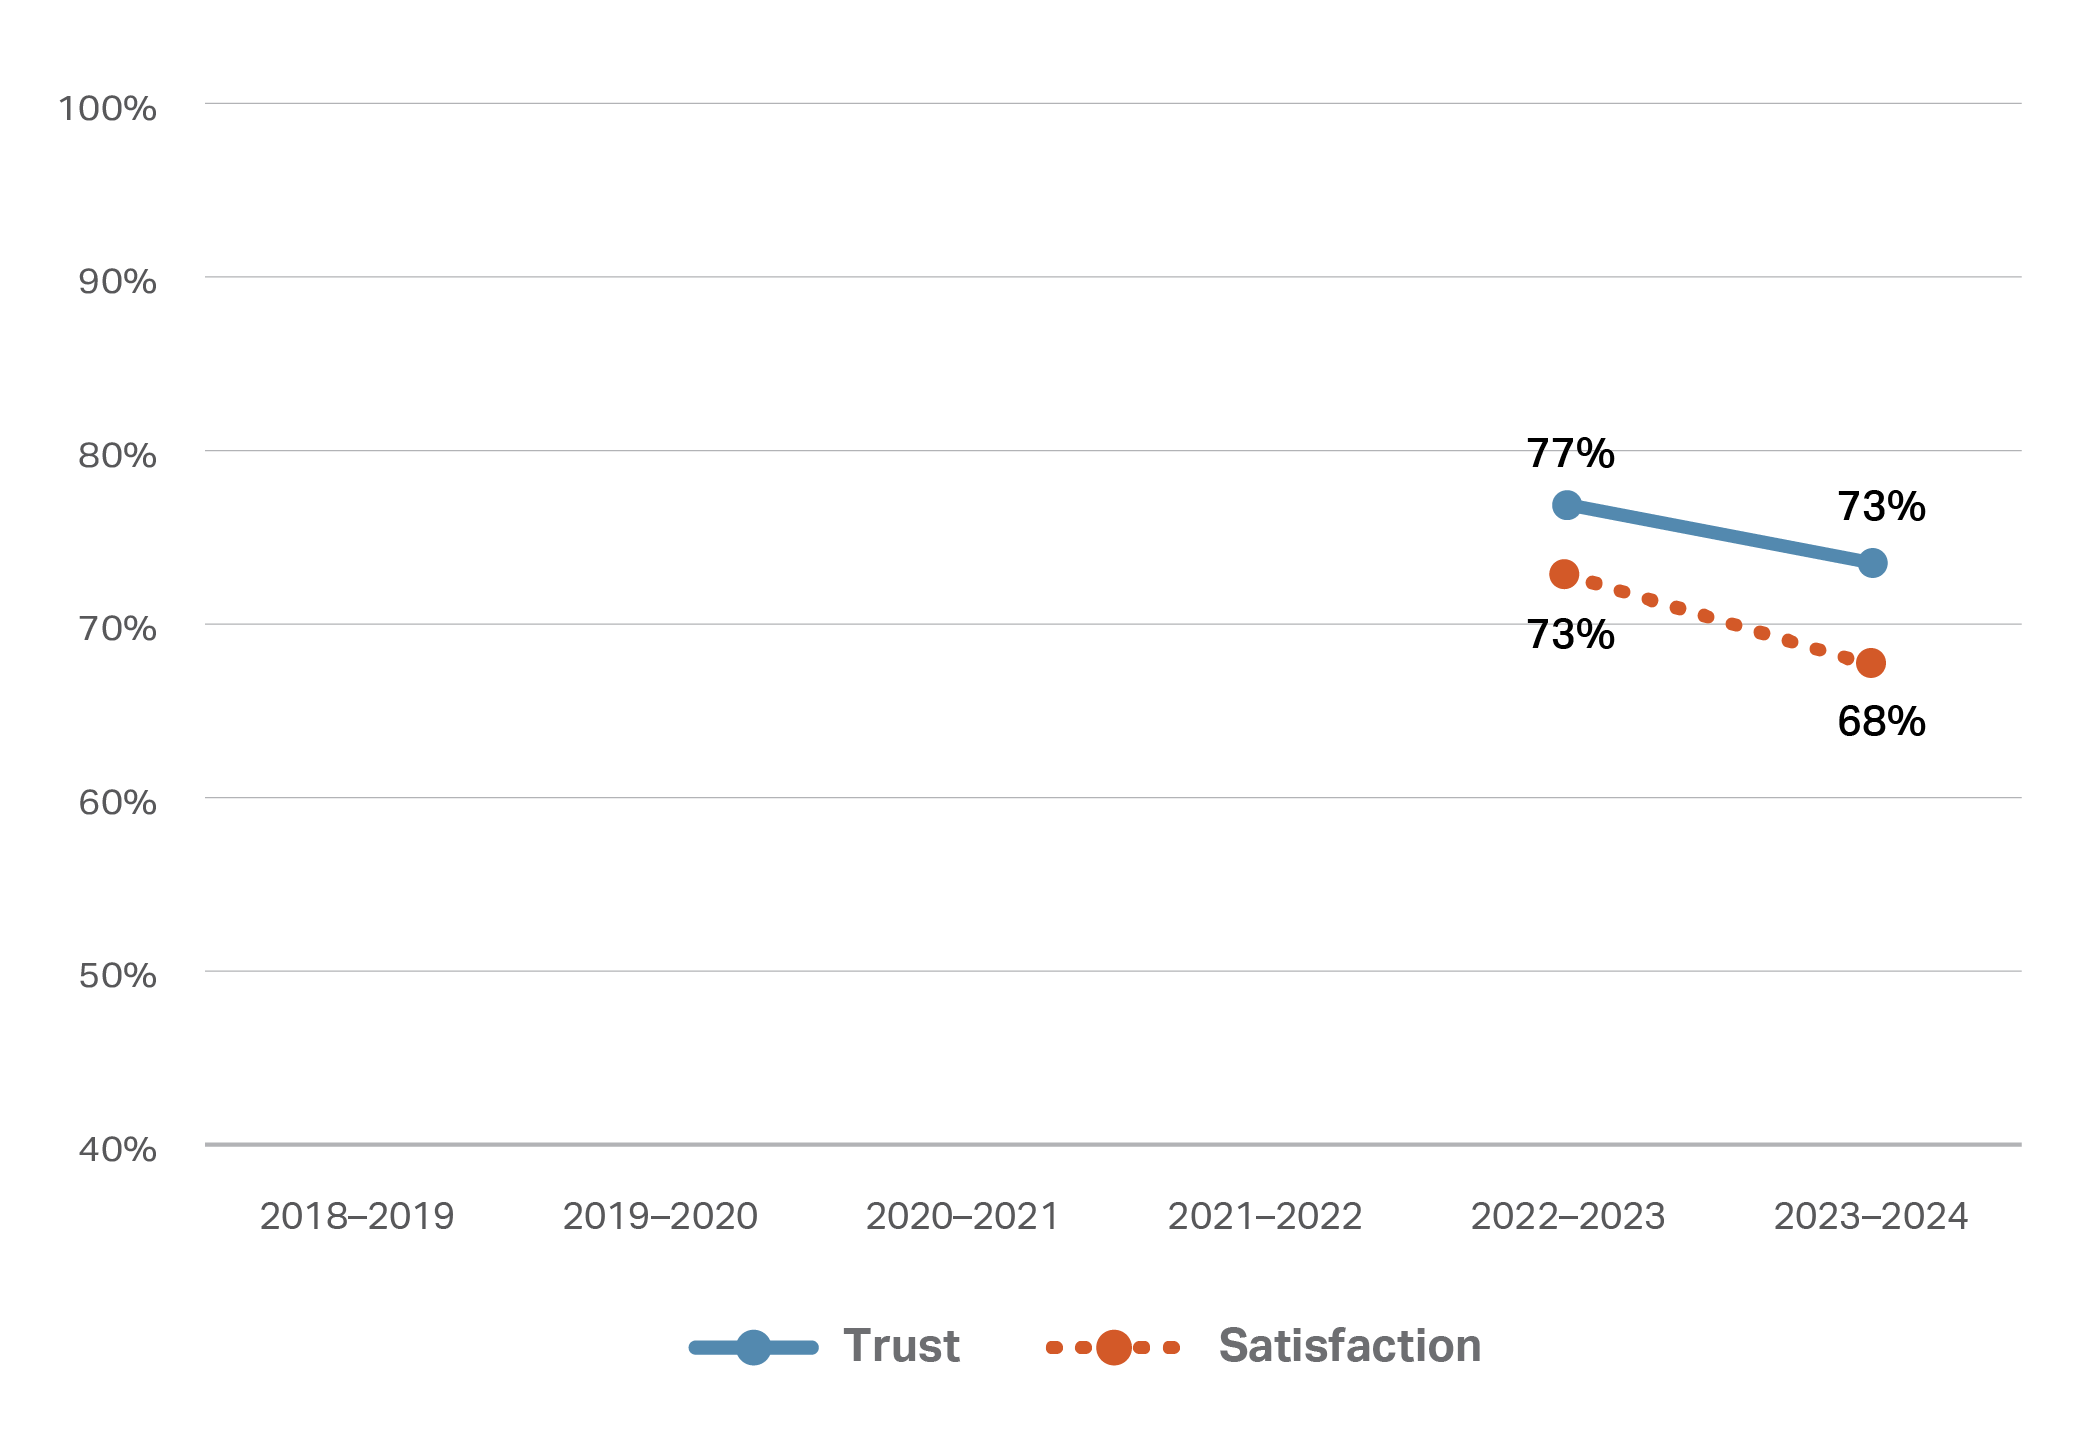
| Note: Department of Education was created in the FY2022-23 as a result of machinery of government changes. |
Department of Employment and Workplace Relations
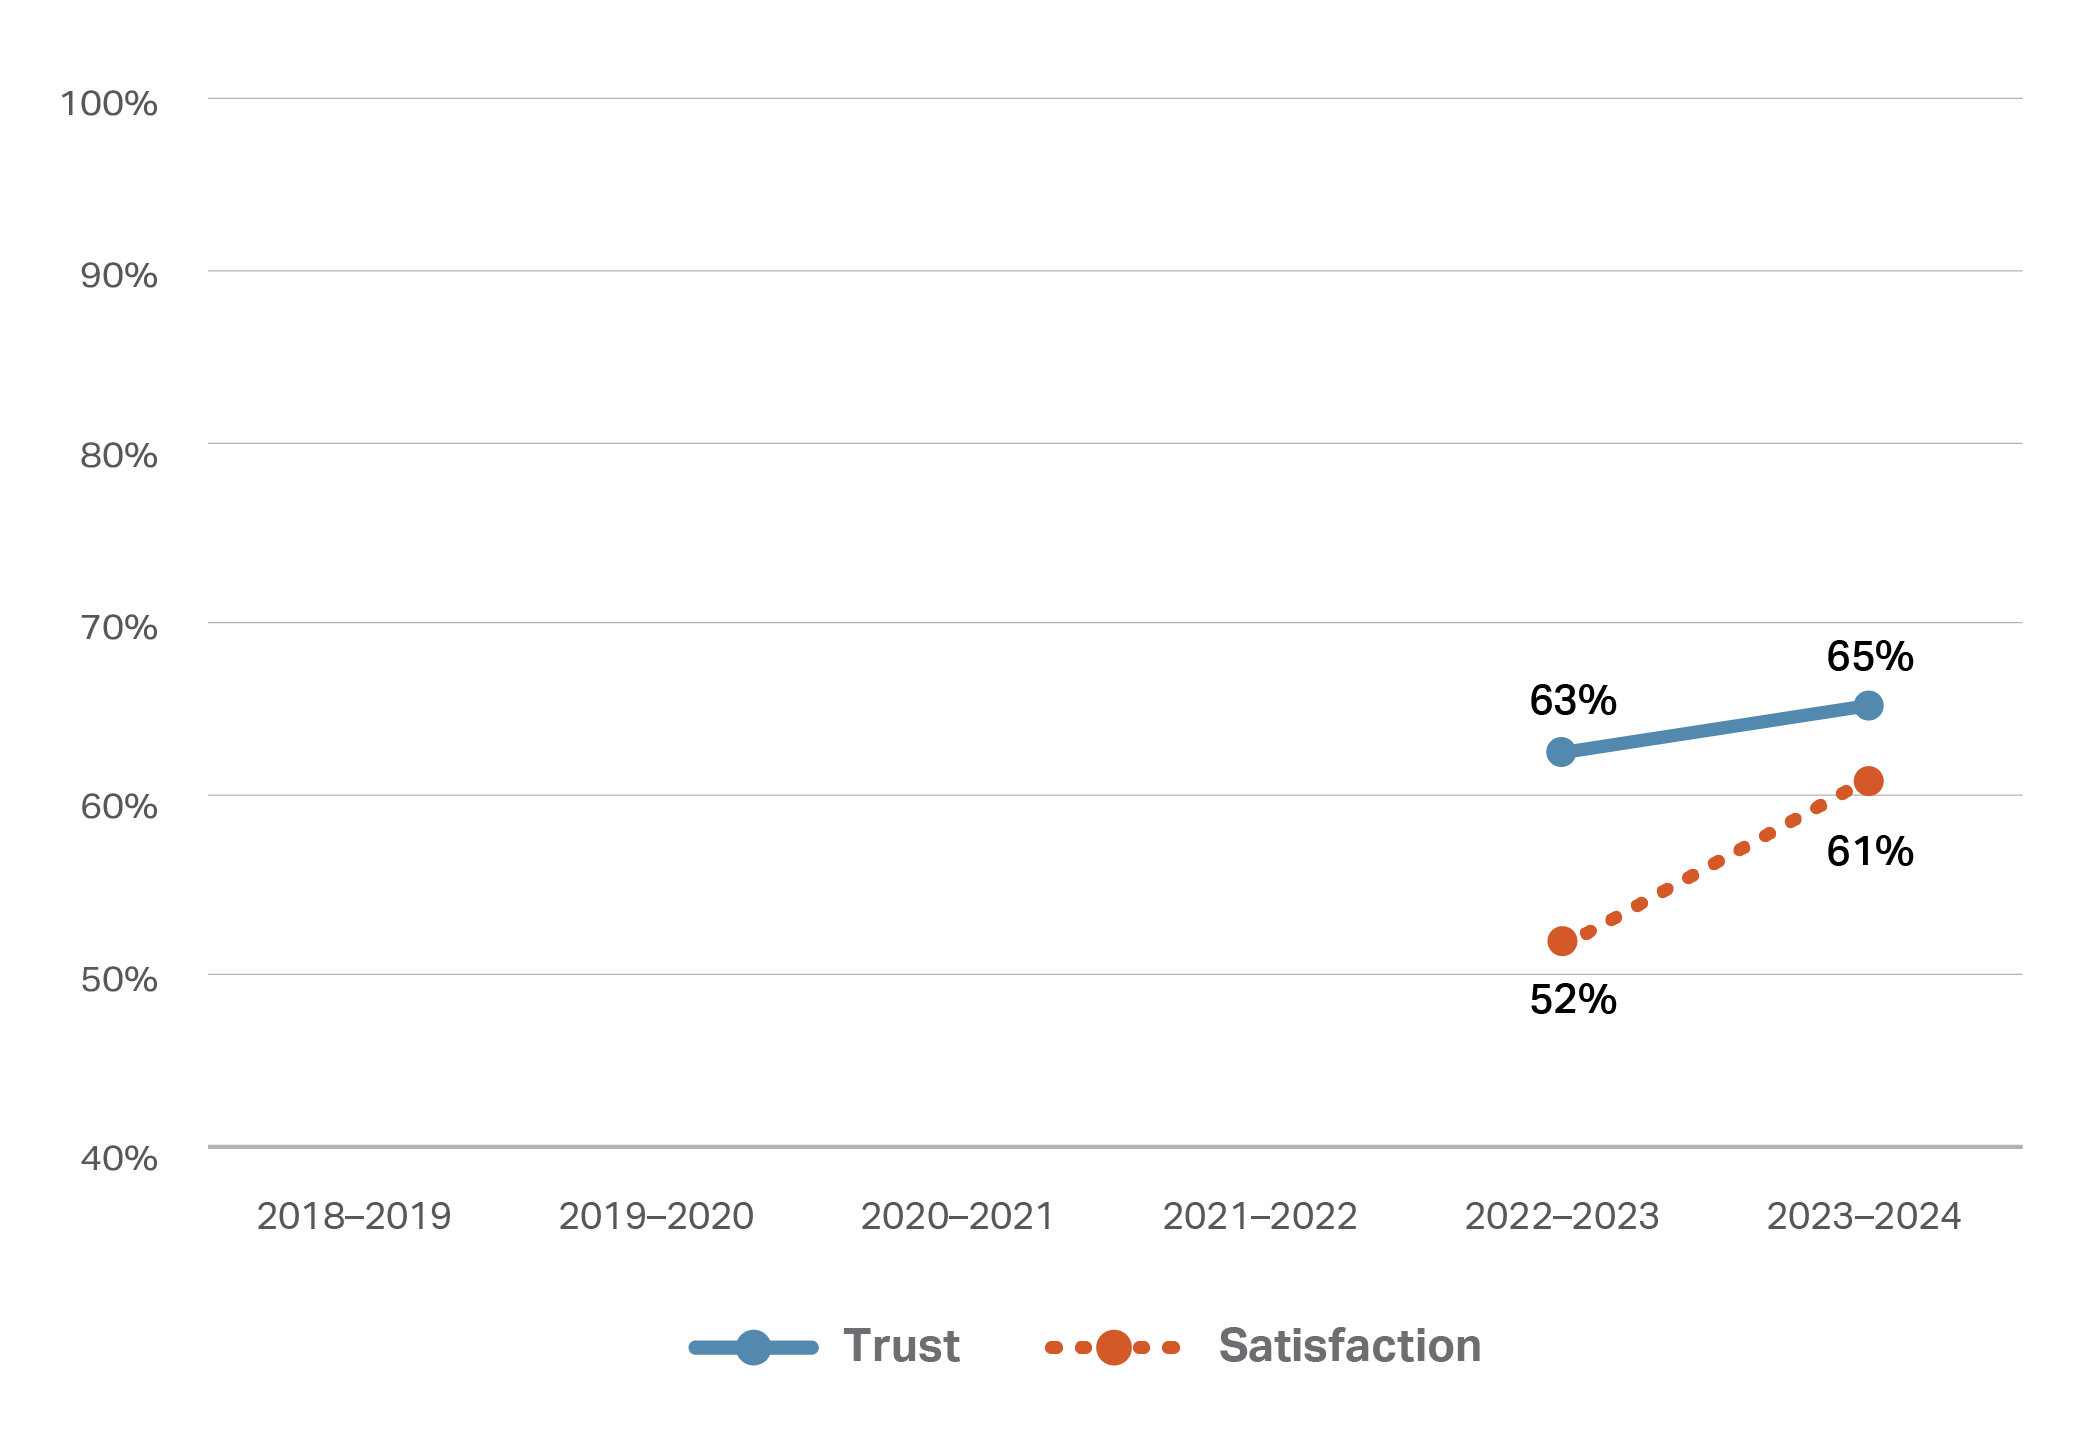
| Note: Department of Employment and Workplace Relations was created in the FY2022-23 as a result of machinery of government changes. |
Department of Foreign Affairs and Trade
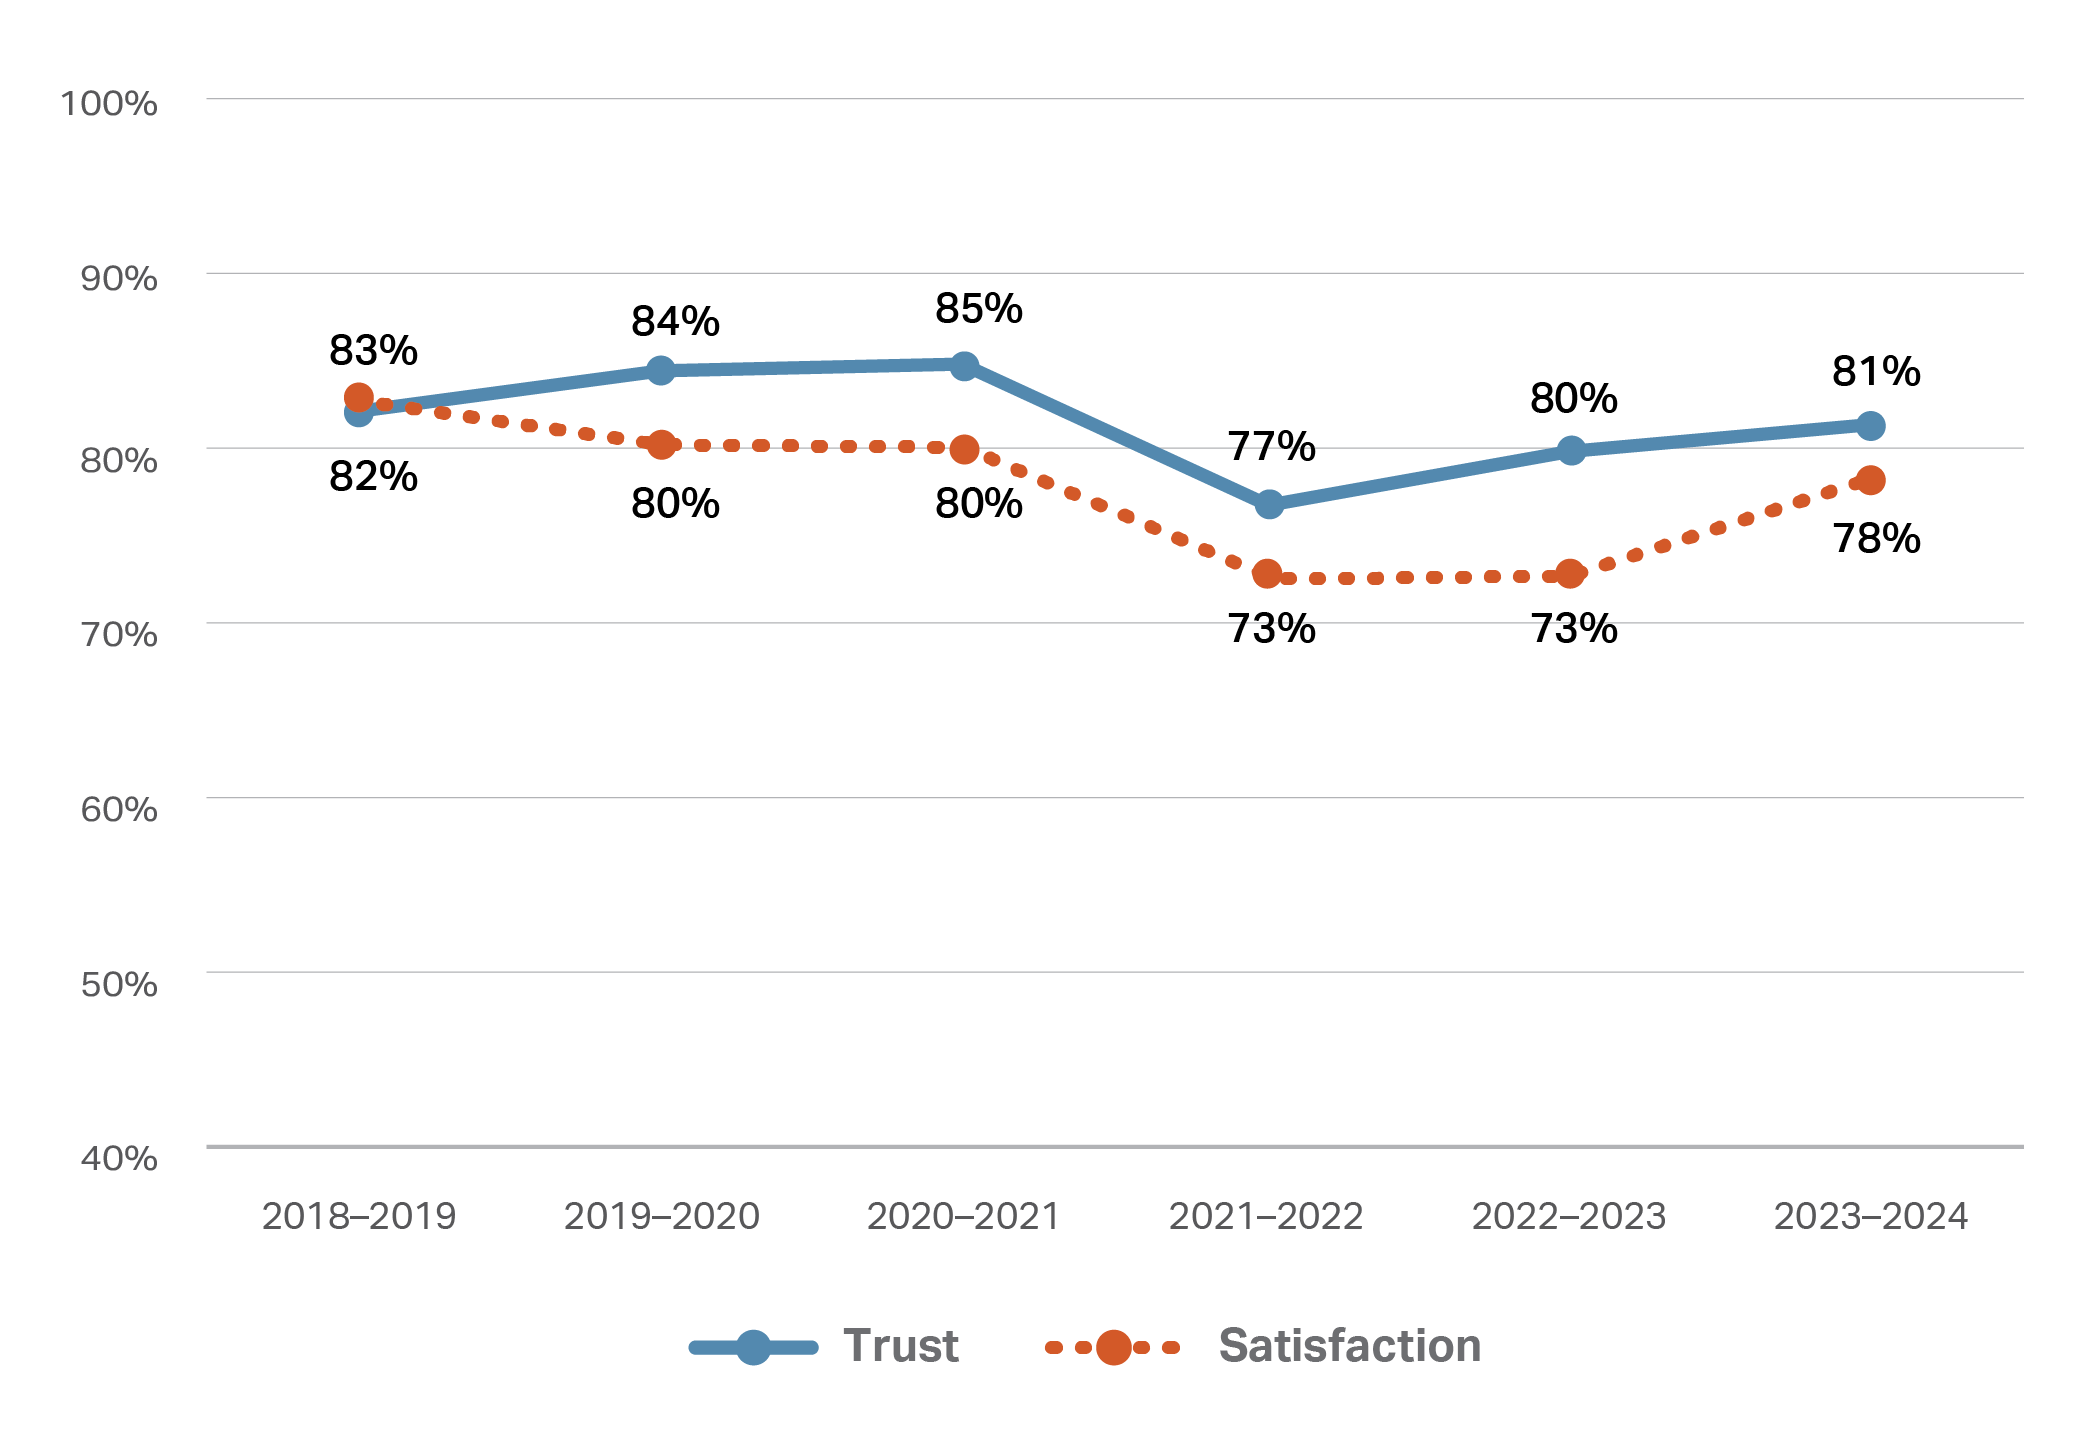
Department of Home Affairs
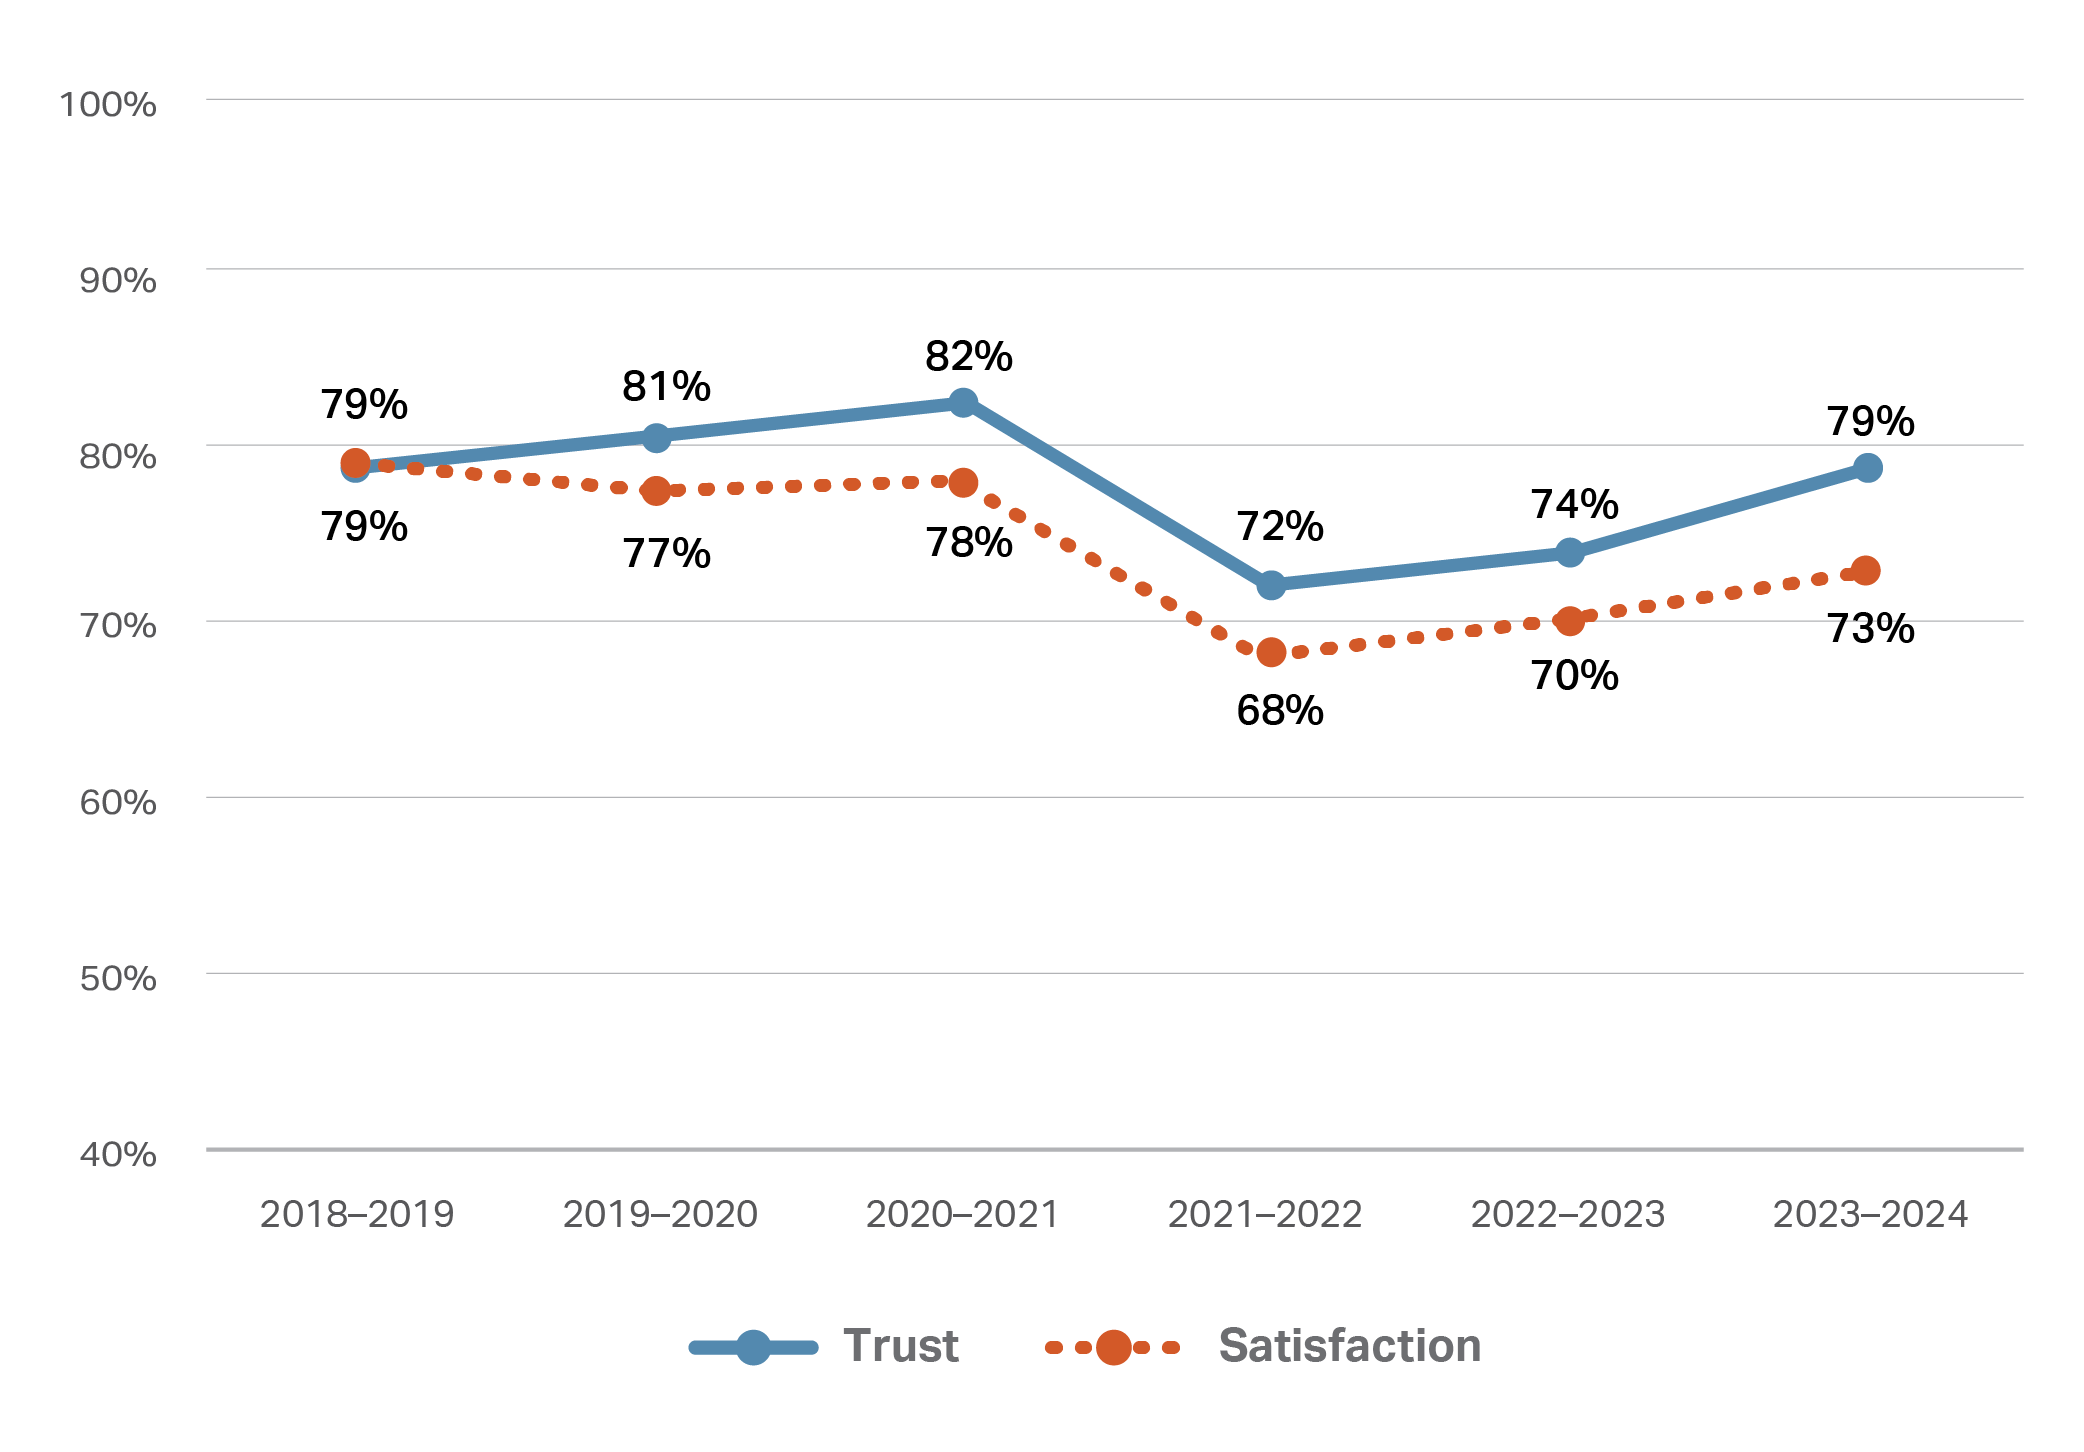
Department of Veterans’ Affairs
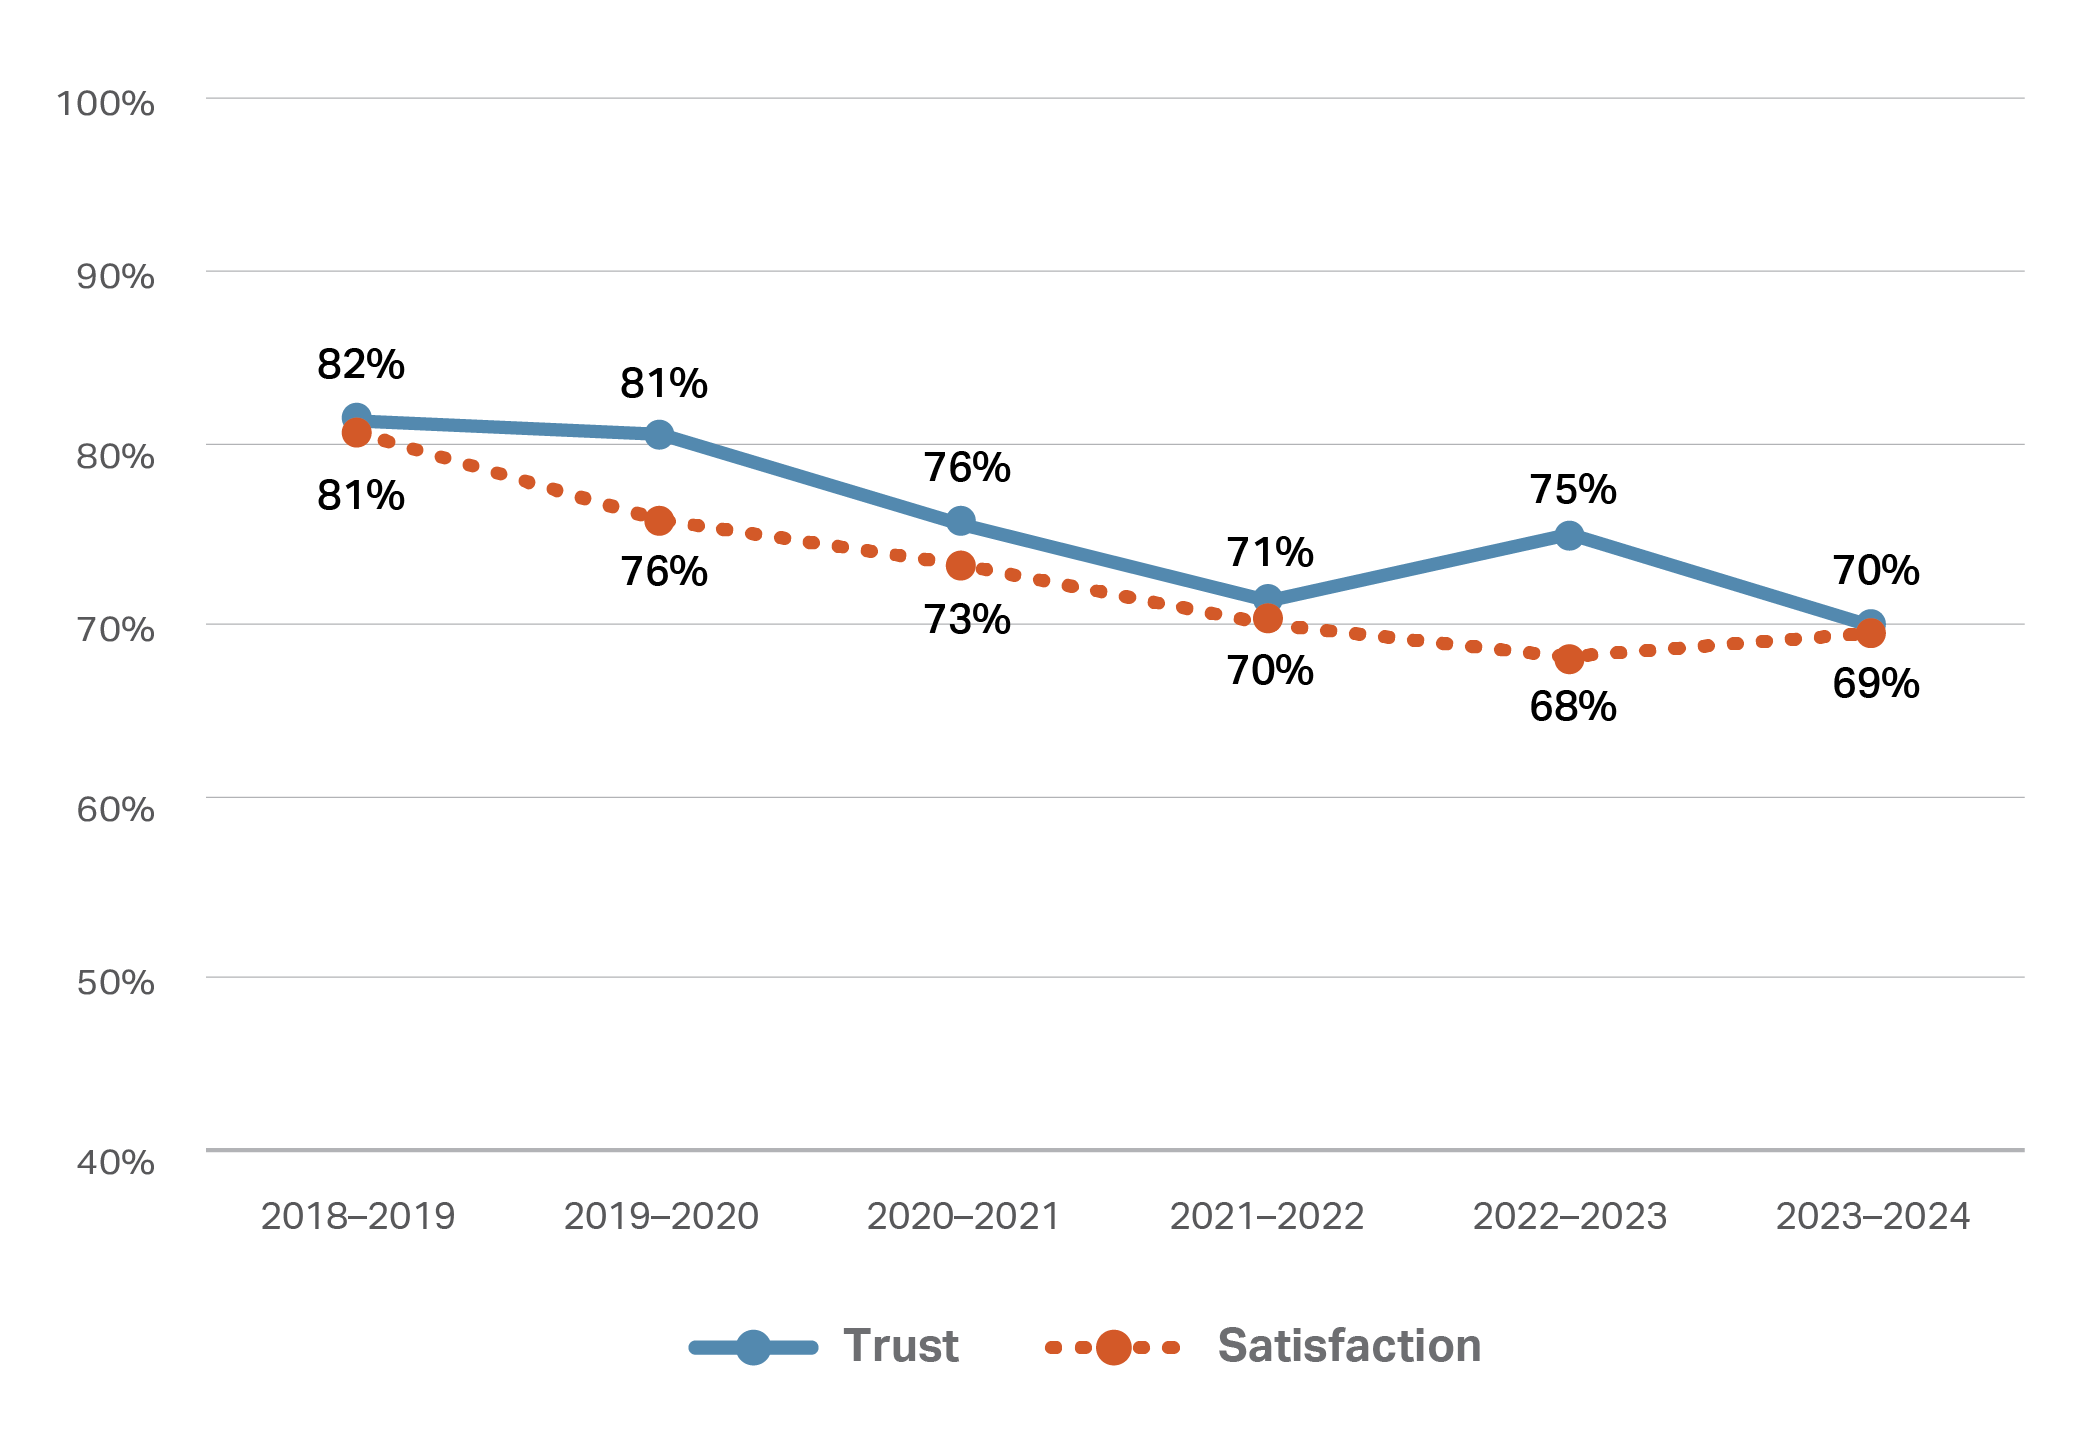
Fair Work Ombudsman
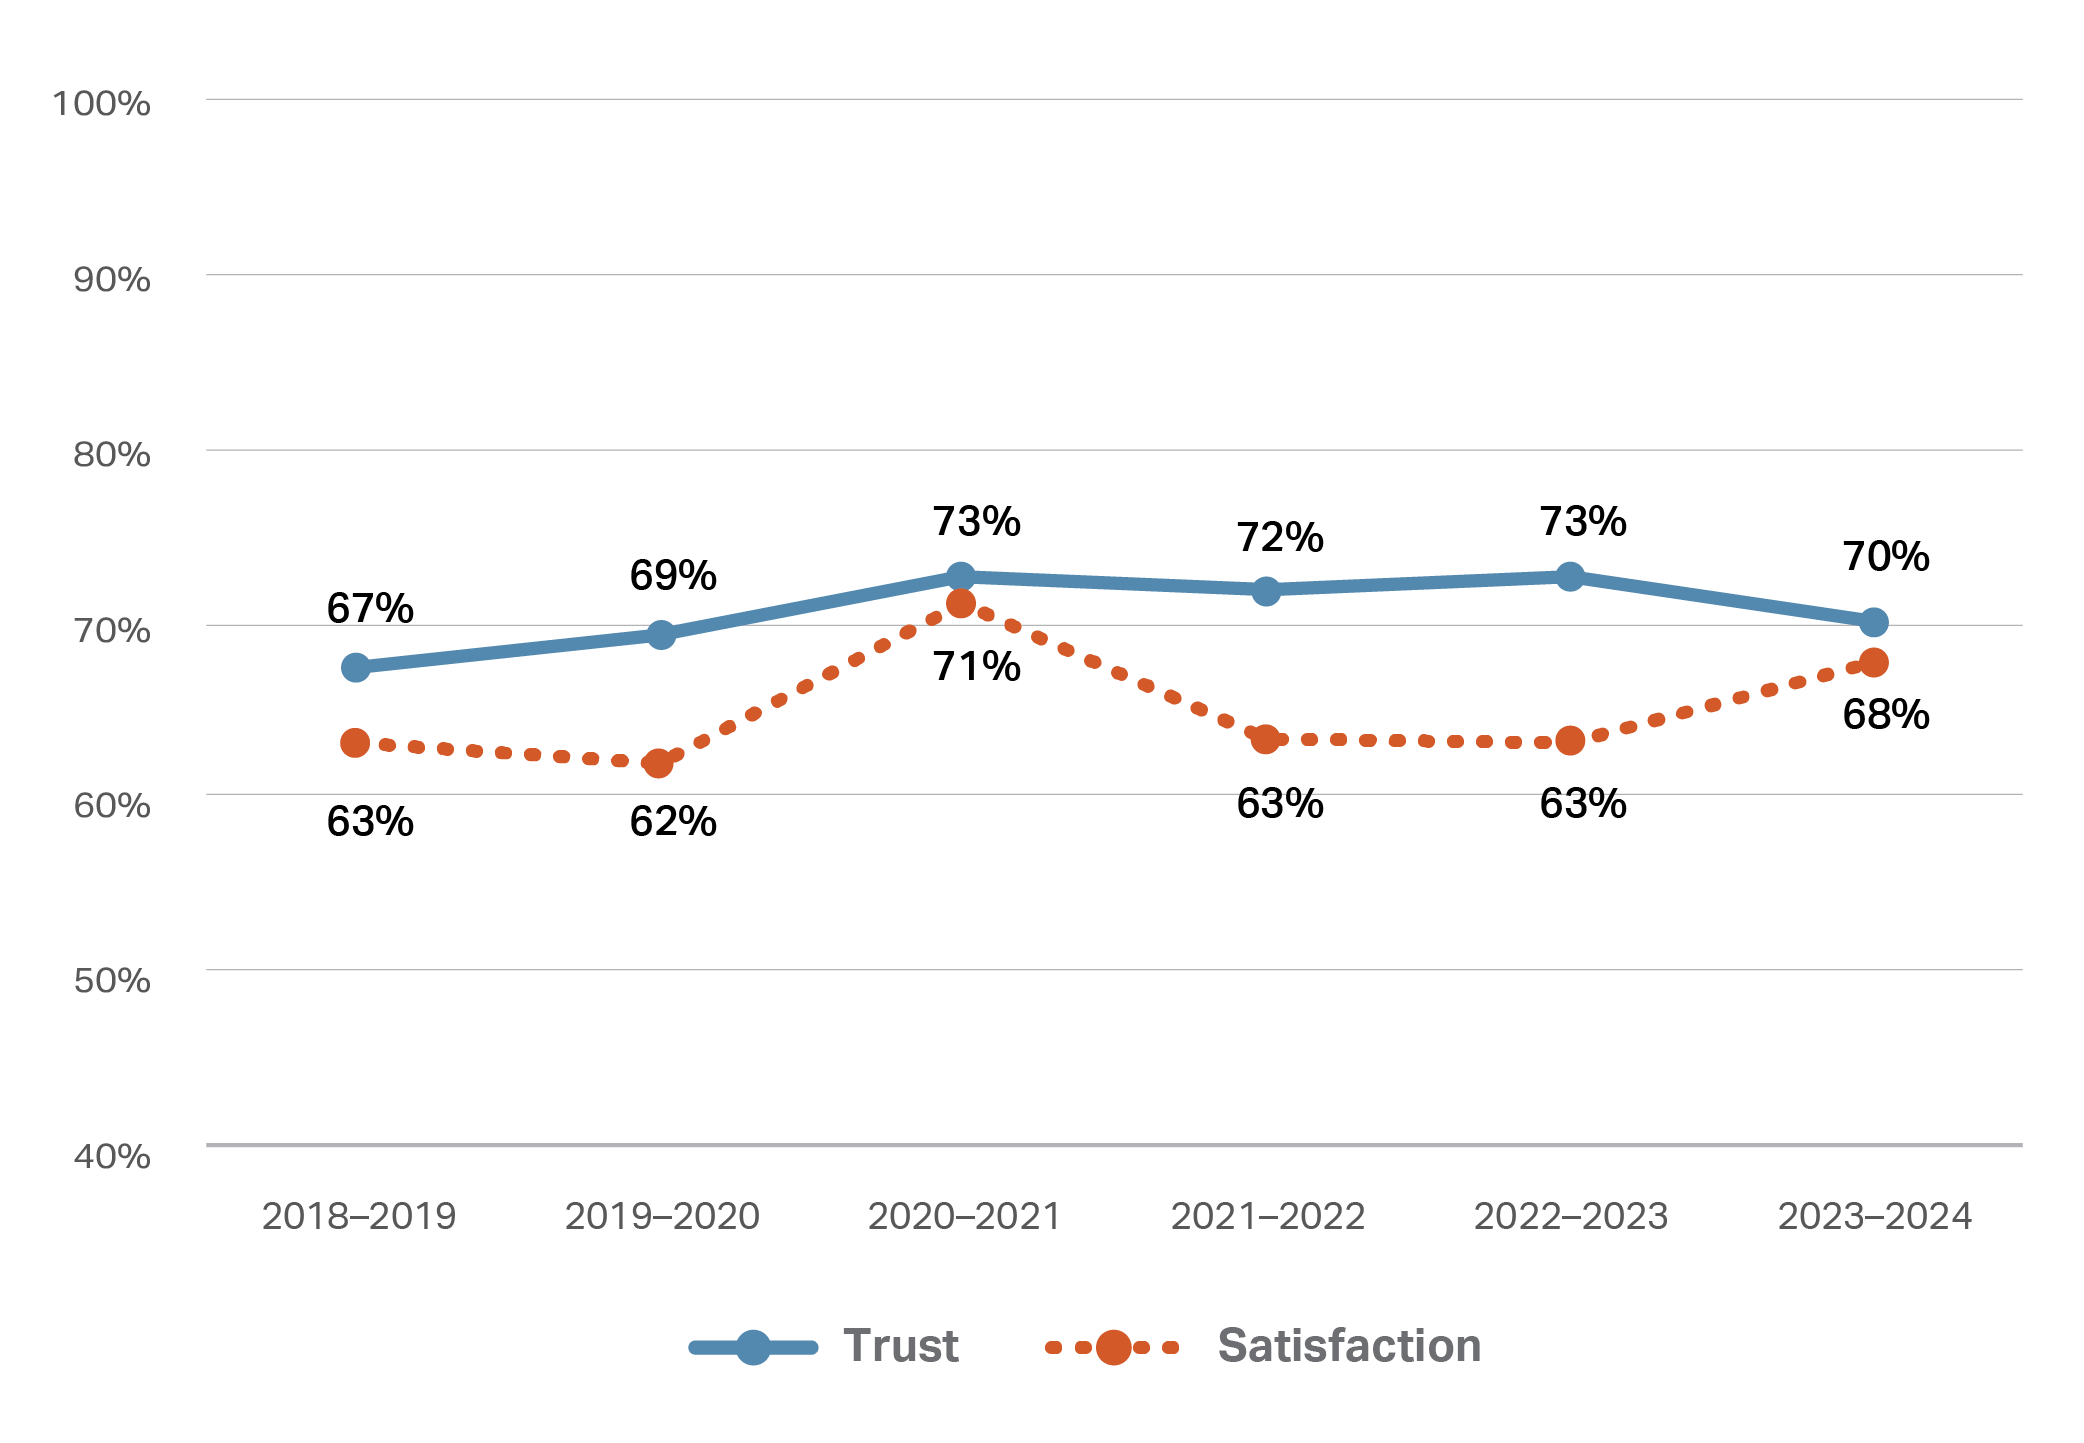
Medicare – Services Australia
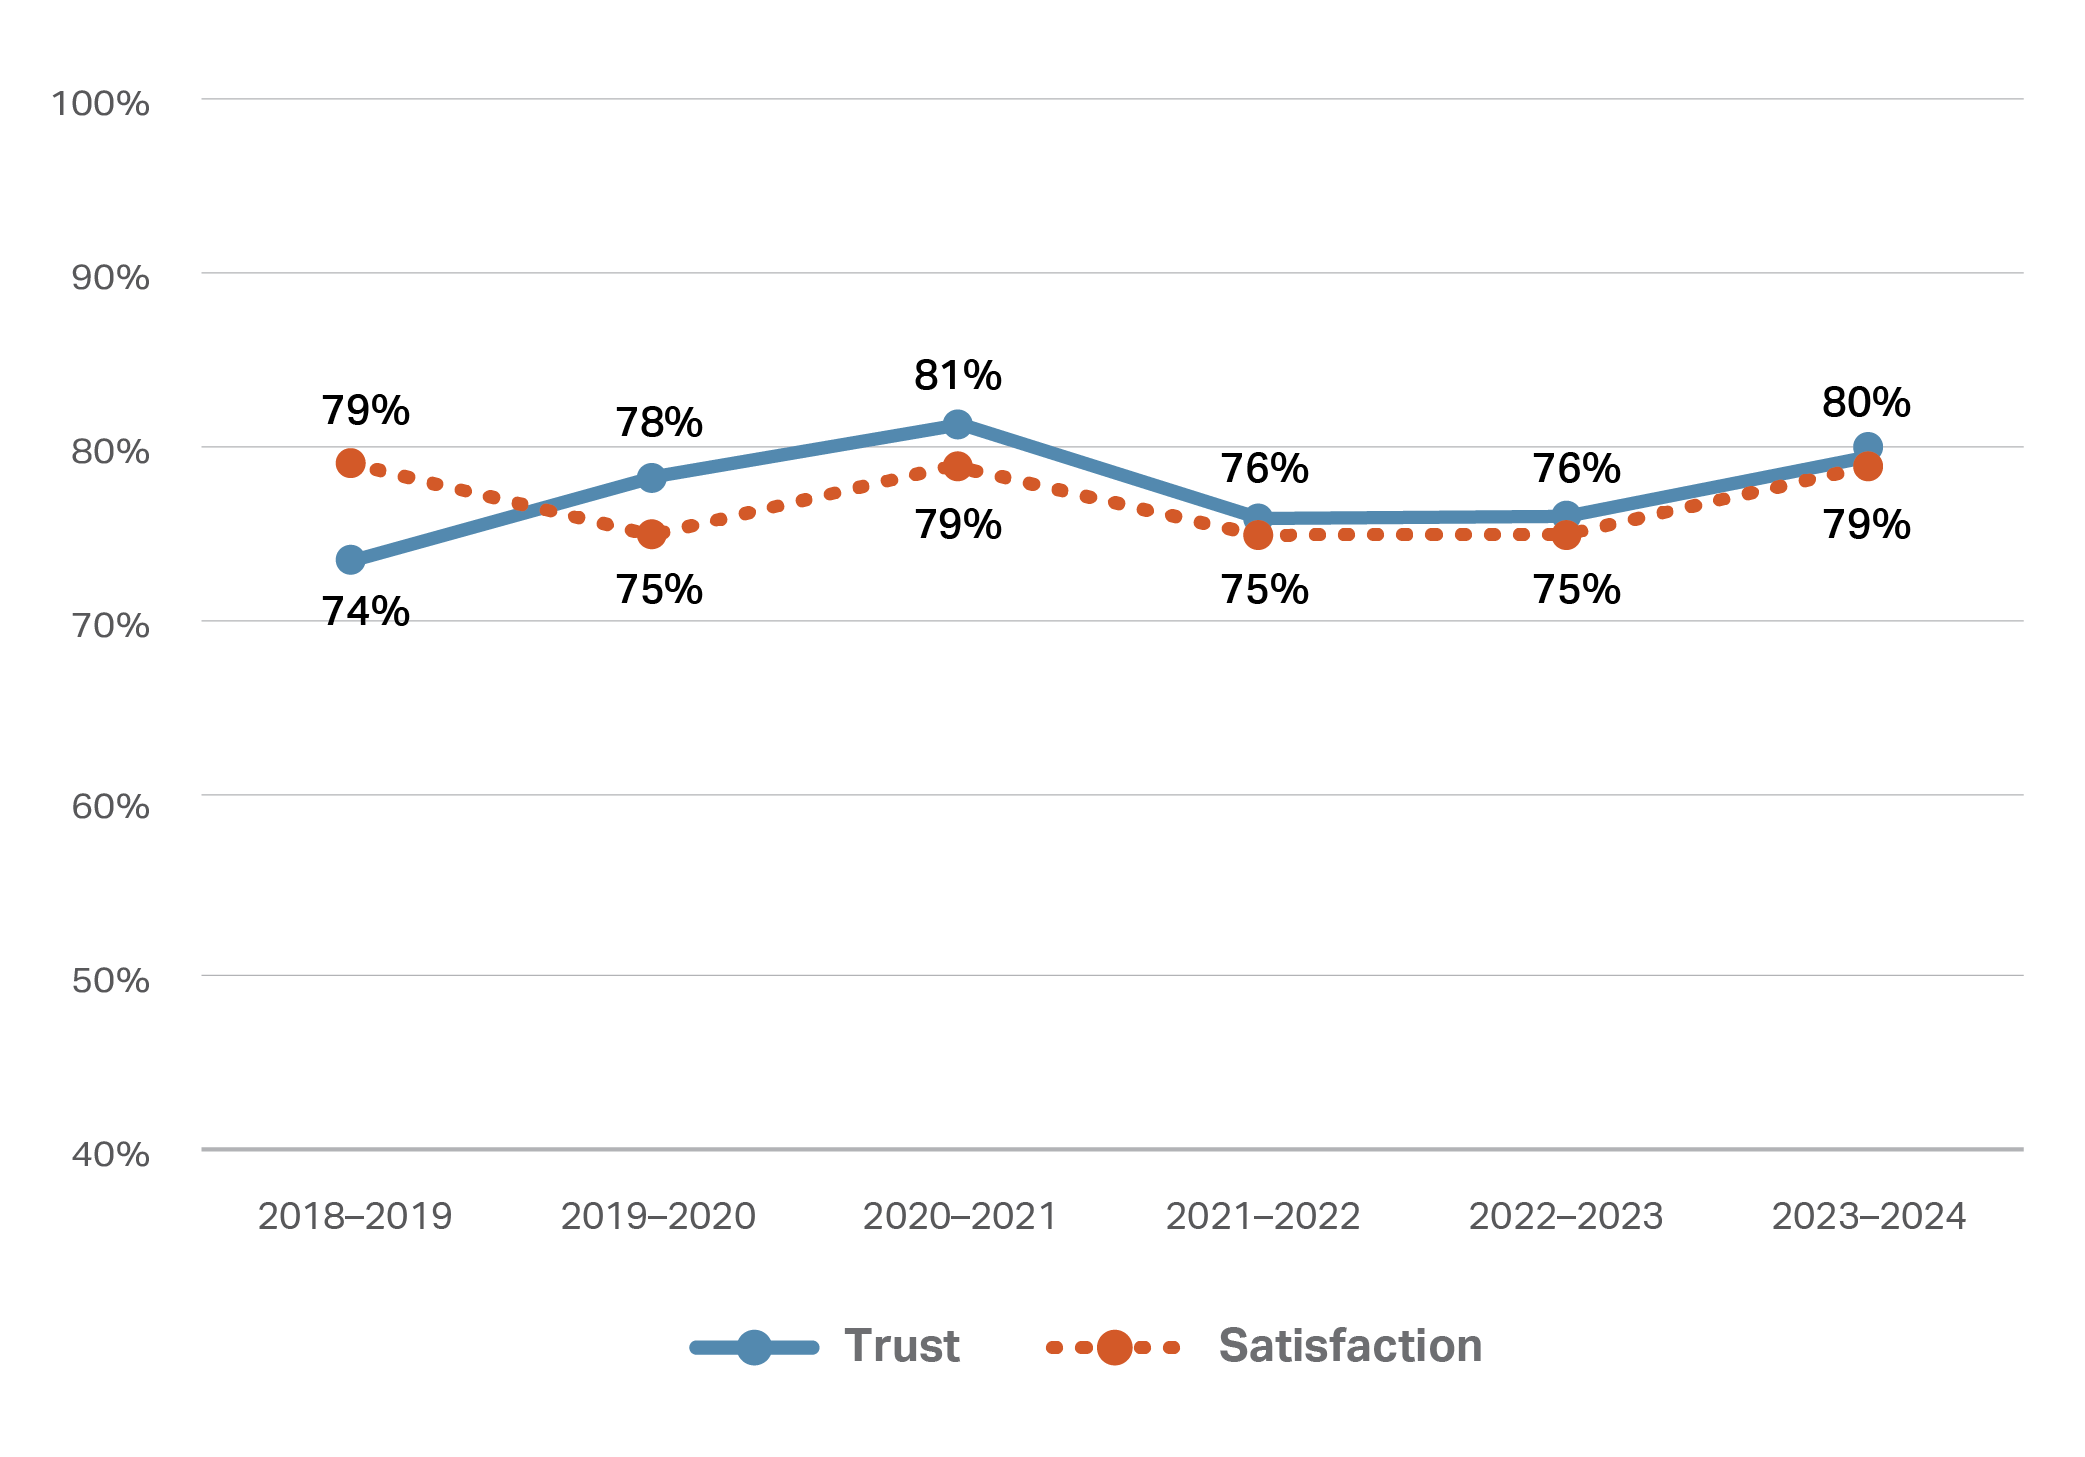
My Aged Care
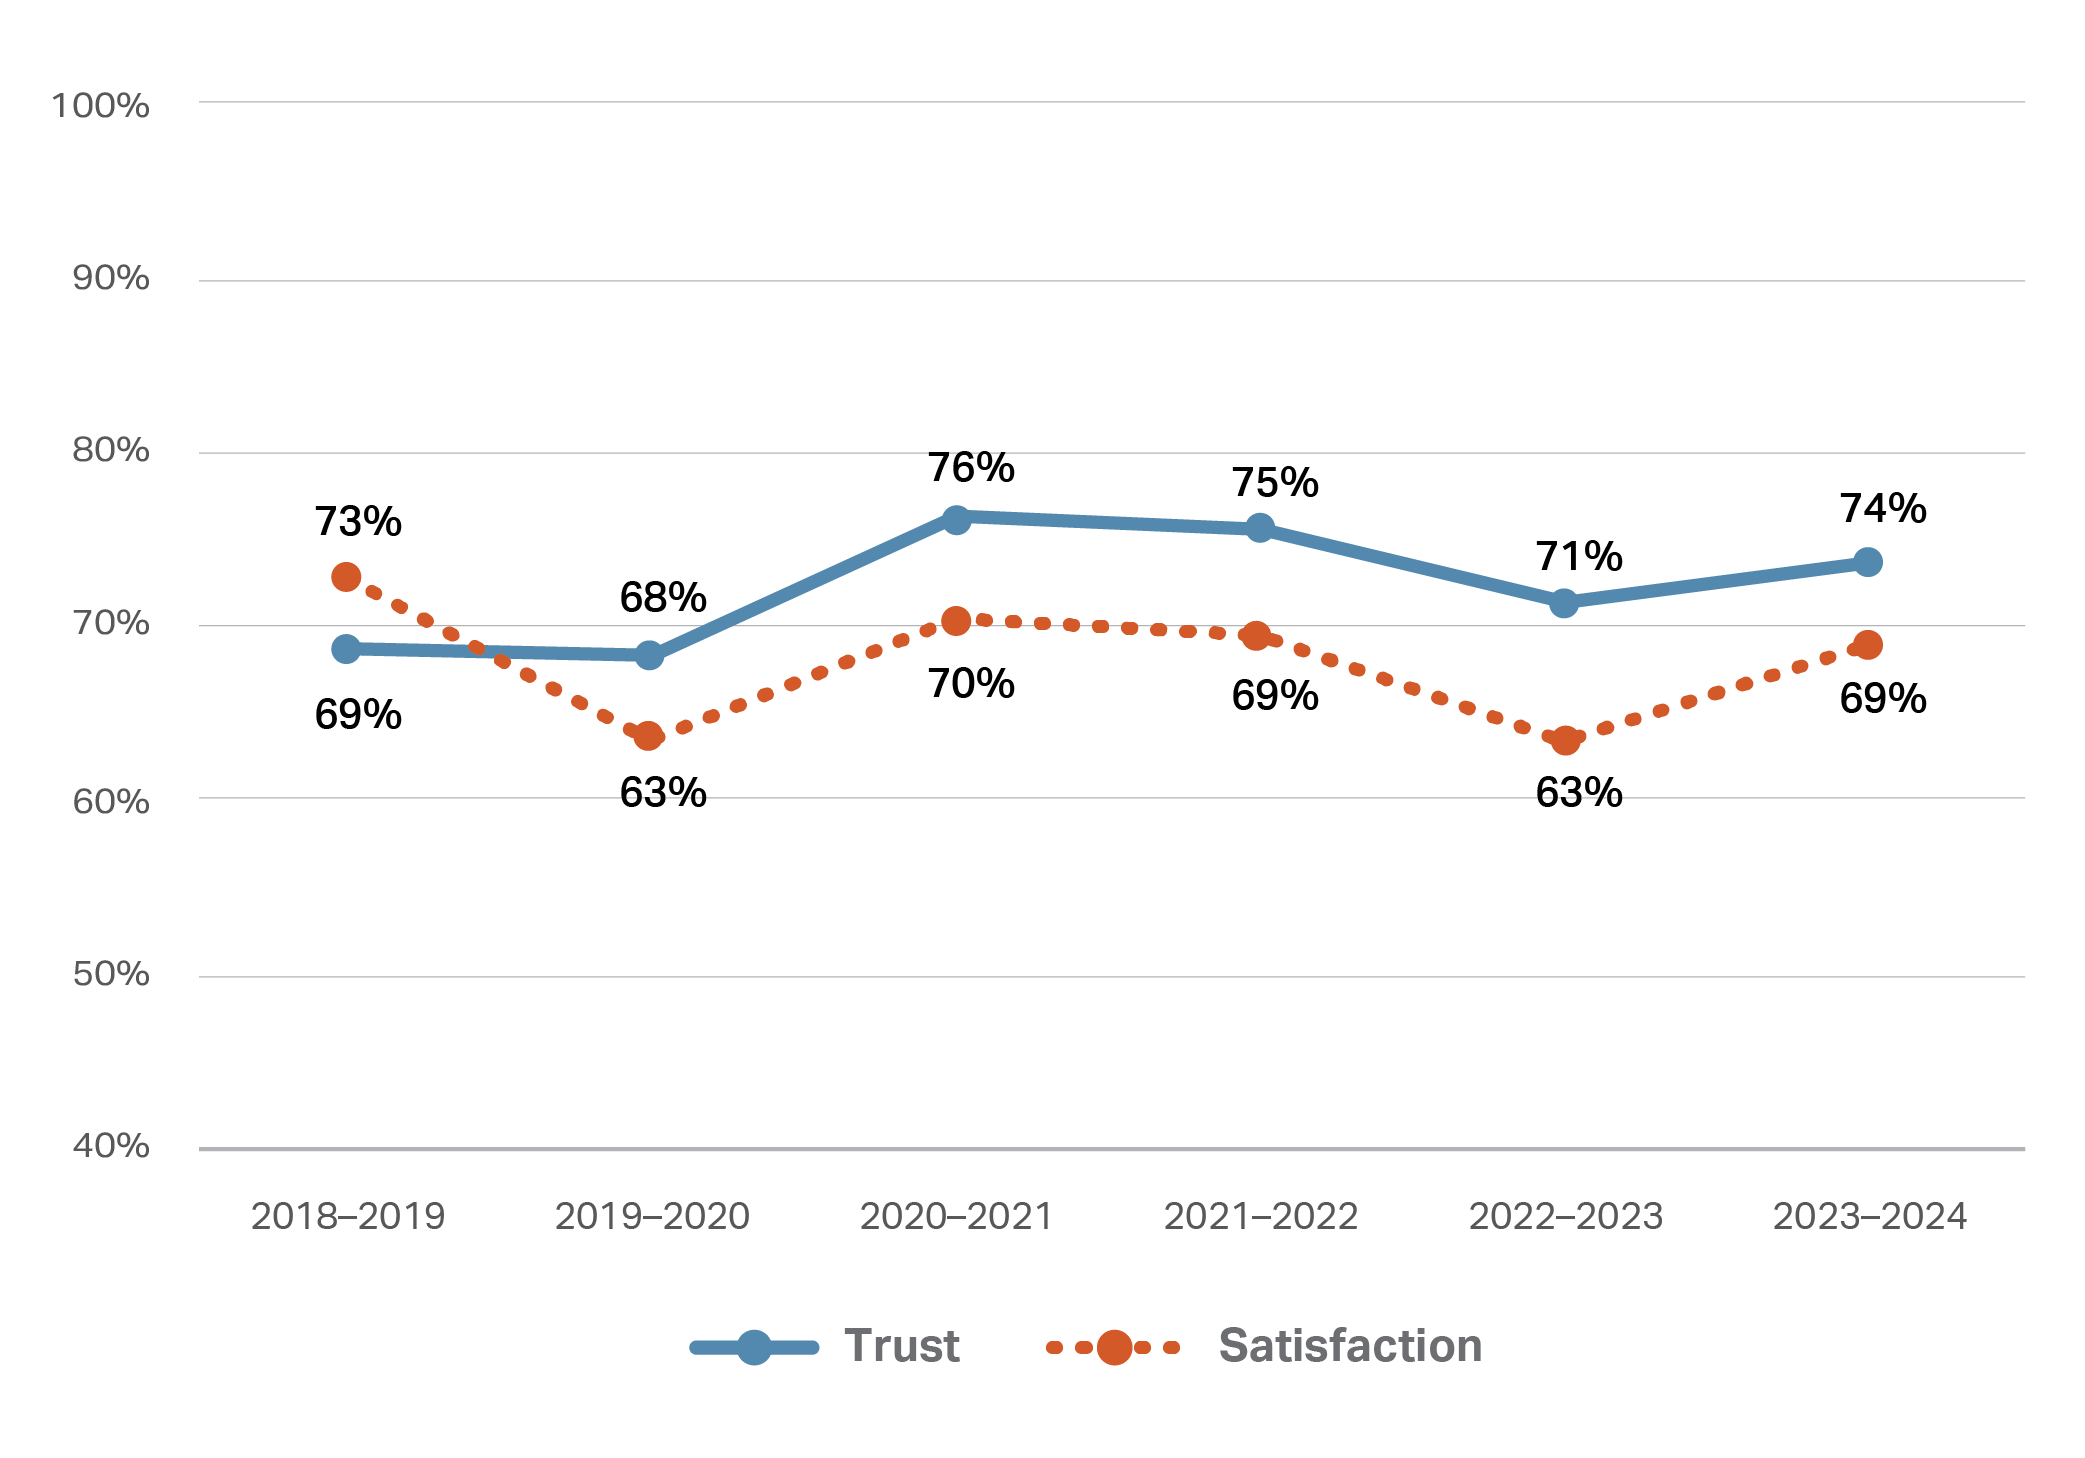
National Disability Insurance Scheme
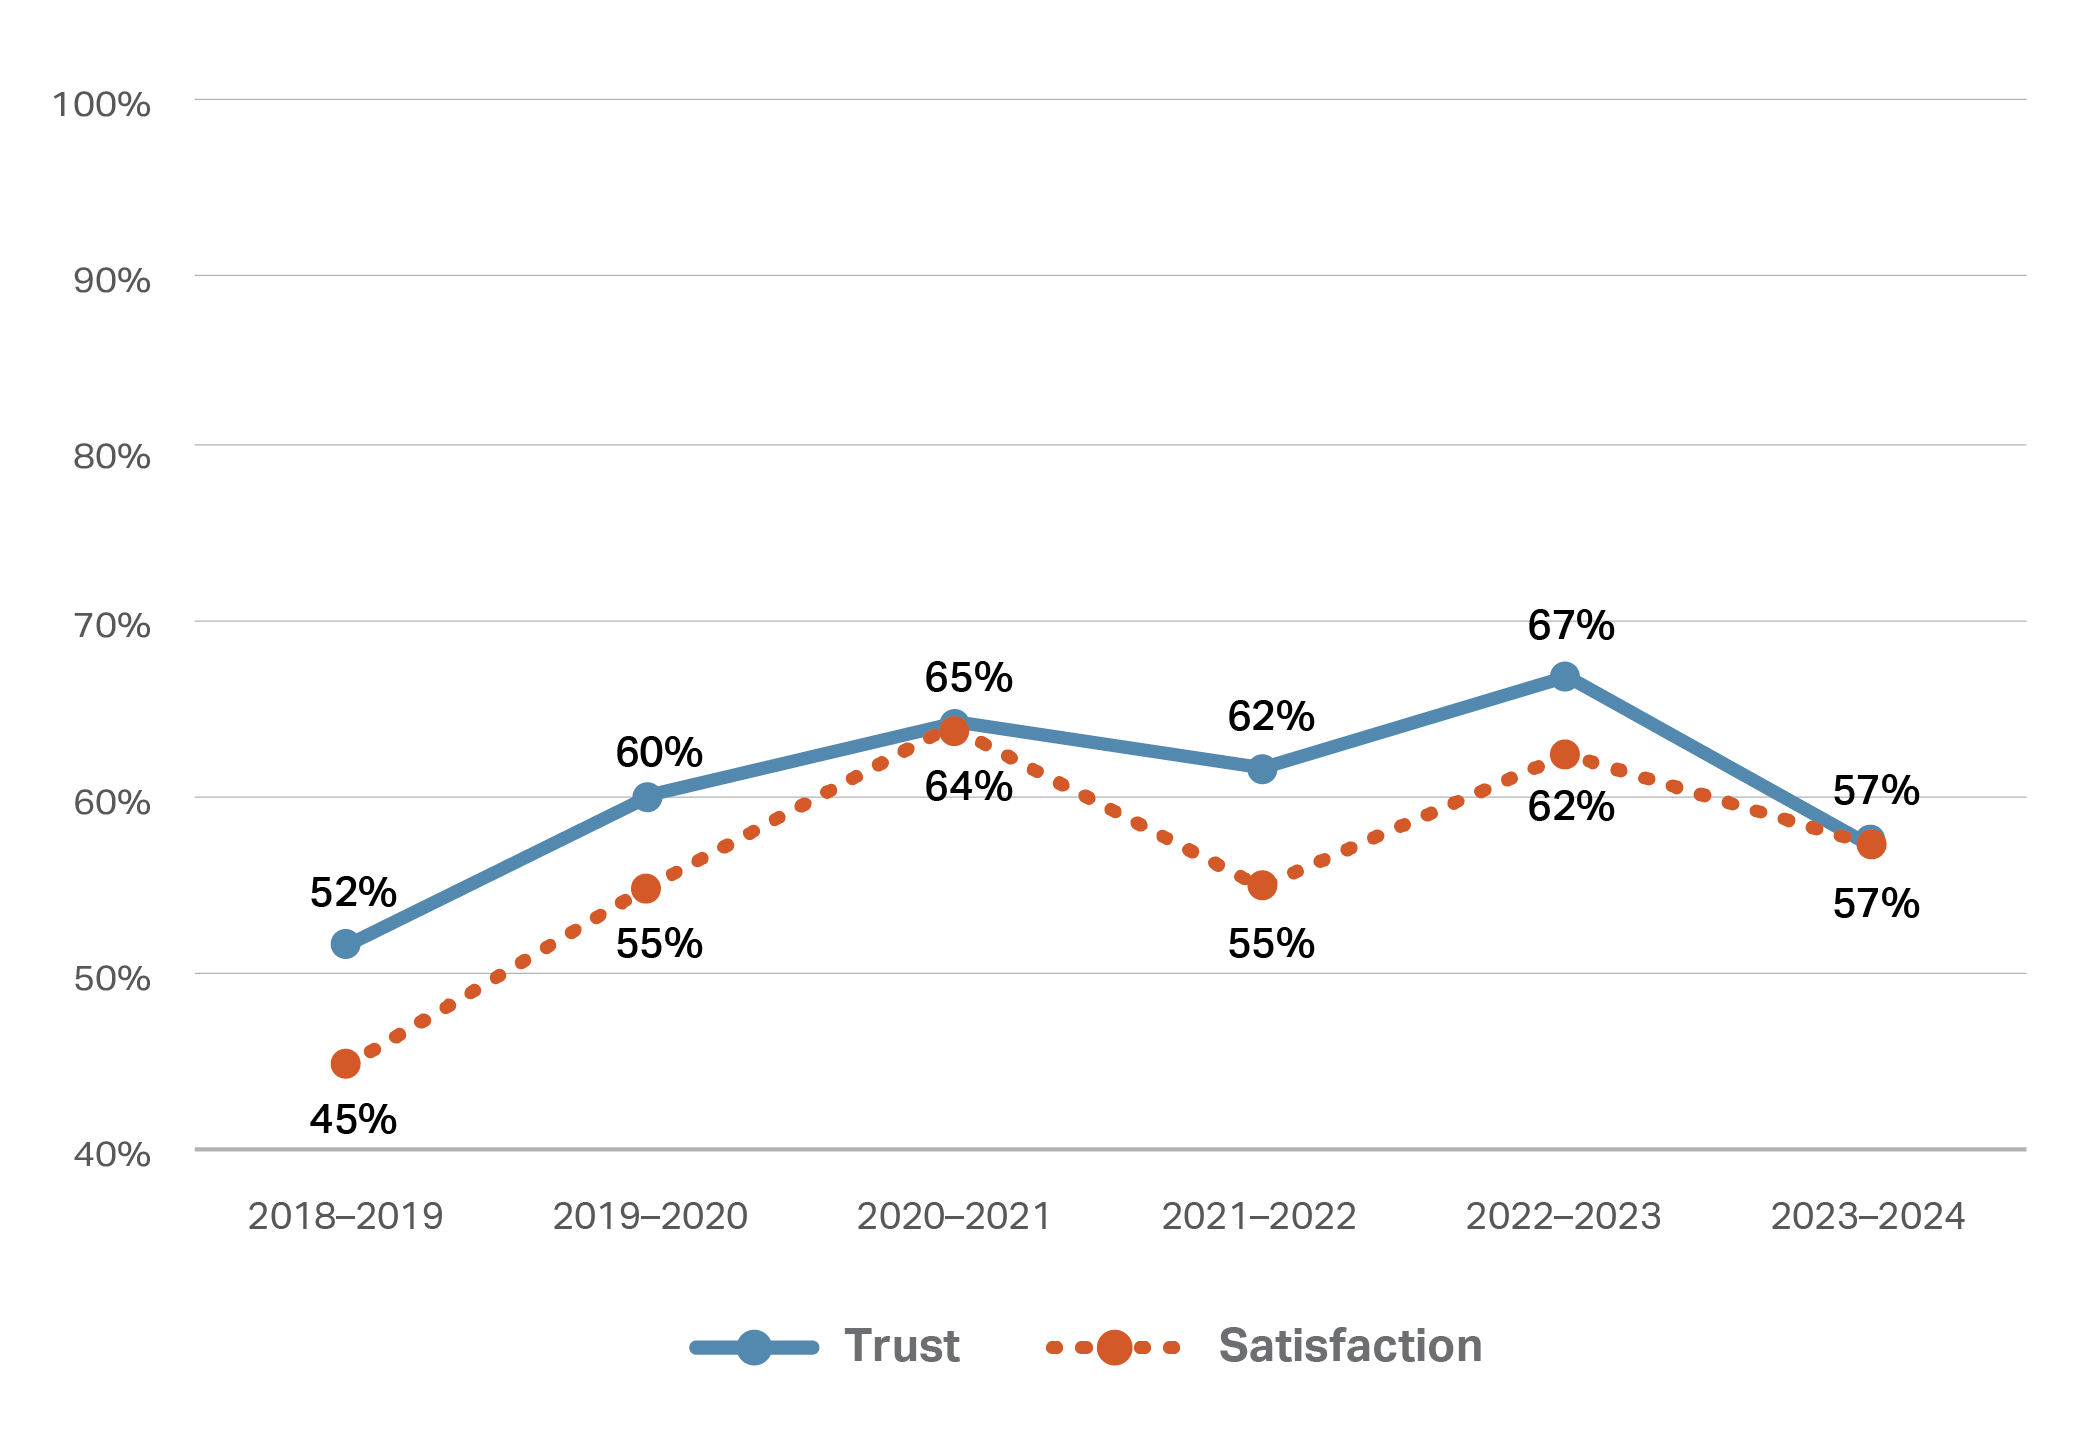
Pharmaceuticals Benefits Scheme
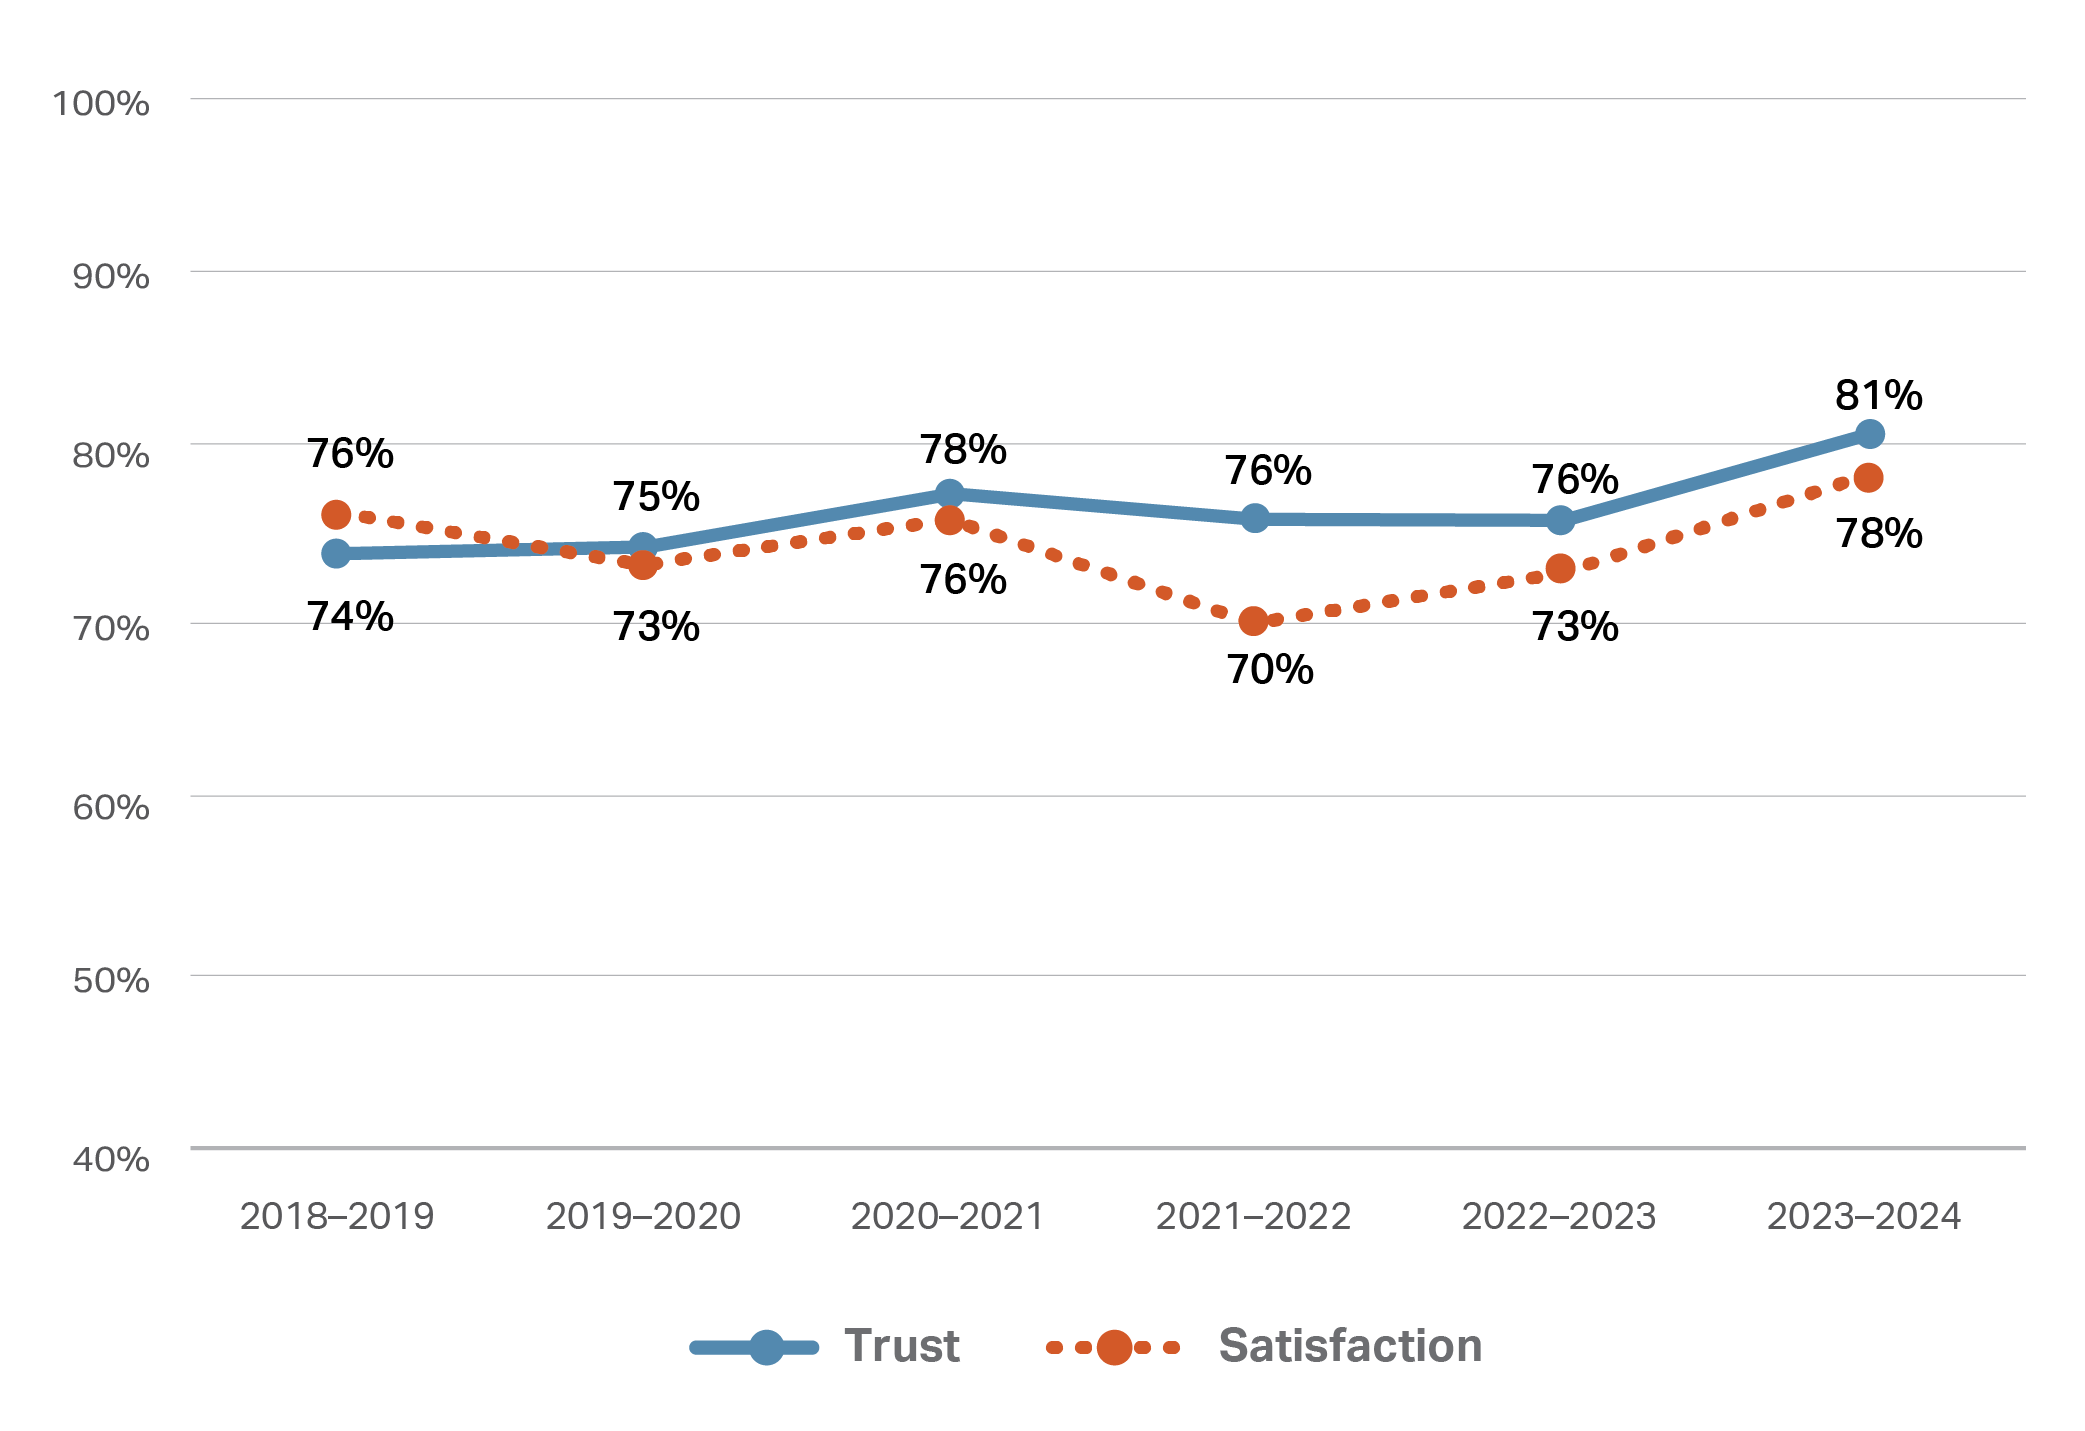
Further resources on trust and satisfaction
Trust and Satisfaction in Australian Democracy: 2023 National Survey
- In partnership with the Strengthening Democracy Taskforce at the Department of Home Affairs, we engaged with over 6,000 Australians in 2023 to explore their sentiment about Australian democracy. Our report provides a detailed overview, revealing people’s satisfaction levels with democracy, underlying their concerns and a resilient desire to strengthen our democracy.
OECD Survey on Drivers of Trust in Public Institutions
- The OECD Trust Survey, launched in 2021, is a biennial survey conducted across the OECD member countries to evaluate trust in public institutions. Australia has participated in the survey since 2021.
- Since 2023, we have collaborated with the OECD on a country study to examine the drivers of trust in public institutions in Australia. The findings from this study will be released in 2025.
Long-term Insights Briefings – How might AI affect the trustworthiness of public service delivery?
- We included three questions in the first wave of the Trust and Satisfaction in Australian Democracy Survey in June 2023, providing data evidence for better understanding the community’s views on the use of AI in the delivery of public service.
Continuing data sharing activities to strengthen transparency
|
Footnotes
[1] Q93 – Overall trust is the proportion of people who answered “Strongly agree” or “Agree” when asked “How much do you agree with the following statement – ‘I can trust Australian public services’”. It also includes a proportion of people who answered “Somewhat agree” before the method changes. See Appendix ”Method changes” for more details.
[5] Q34 – Proportion of people who answered “Strongly agree” or “Agree” when asked how much they agreed with statements about their service experience. The proportion is adjusted pro rata for the amount of services each individual was asked about. It also includes a proportion of people who answered “Somewhat agree” before the method changes. See Appendix “Method changes” for more details.
[6] Q34 – Proportion of people who answered “Strongly disagree” or “Disagree” when asked how much they agreed with statements about their service experience. The proportion is adjusted pro rata for the amount of services each individual was asked about. It also includes a proportion of people who answered “Somewhat disagree” before the method changes. See Appendix “Method changes” for more details.
[8] Q44 – Life satisfaction is the proportion of people who answered “Completely satisfied” or “Satisfied” when asked “Overall how satisfied or dissatisfied are you with life as a whole these days?” It also includes a proportion of people who answered “Somewhat satisfied” before the method changes. See Appendix “Method changes” for more details.
[9] Q45 – Trust in other people is the proportion of people who answered “Strongly agree” or “Agree” when asked “How much do you agree or disagree with the following statement – ‘Most people can be trusted’”. It also includes a proportion of people who answered “Somewhat agree” before the method changes. See Appendix “Method changes” for more details.
[10] . Q25 – Dissatisfaction with a service is the proportion of people who answered “Completely dissatisfied” or “Dissatisfied” when asked “Thinking about your experience with the services you accessed from each of the following, how satisfied or dissatisfied are you?”.
[10] Q26 – Proportion of people who answered each statement in the graph for at least one service they accessed when asked “Thinking about your experience with each of the services you accessed, what were you most dissatisfied with?”. The question was only asked of people who answered “Completely dissatisfied” or “Dissatisfied” to Q25 (see note 10). This question was included in the survey between November 2023 and June 2024.
