[toc]
In 2024...
| 58%[1] of people reported trusting public services in 2024, while only 13 [7] reported distrust. | Image
|
| 68%[3] of people who accessed public services reported being satisfied with them. | Image
|
| 86% of people who reported trusting public services were also satisfied with them, while 30% of people who distrusted services were still satisfied with services. | Image
|
How do we compare?
OECD Survey on Drivers of Trust in Public Institutions
In July 2024, the OECD launched the OECD Survey on Drivers of Trust in Public Institutions: 2024 Results. Key findings for Australia include:
- Australians’ trust in the federal government was 46% in 2023, exceeding the OECD average of 39%, and ranking 9th out of the 30 countries surveyed.
- For all the considered measures, Australians' satisfaction with day-to-day interactions with government was above the OECD average.
New Zealand’s Kiwis Count Survey
- The Kiwis Count survey measures the trust and confidence of New Zealanders in the Public Service, based on their most recent service experience and perception of the Public Service overall.
- Latest results as of June 2024 show that 56% of New Zealanders trust Public Service overall and 80% report trust in public services based on their most recent experience.
Trust and satisfaction remain stable
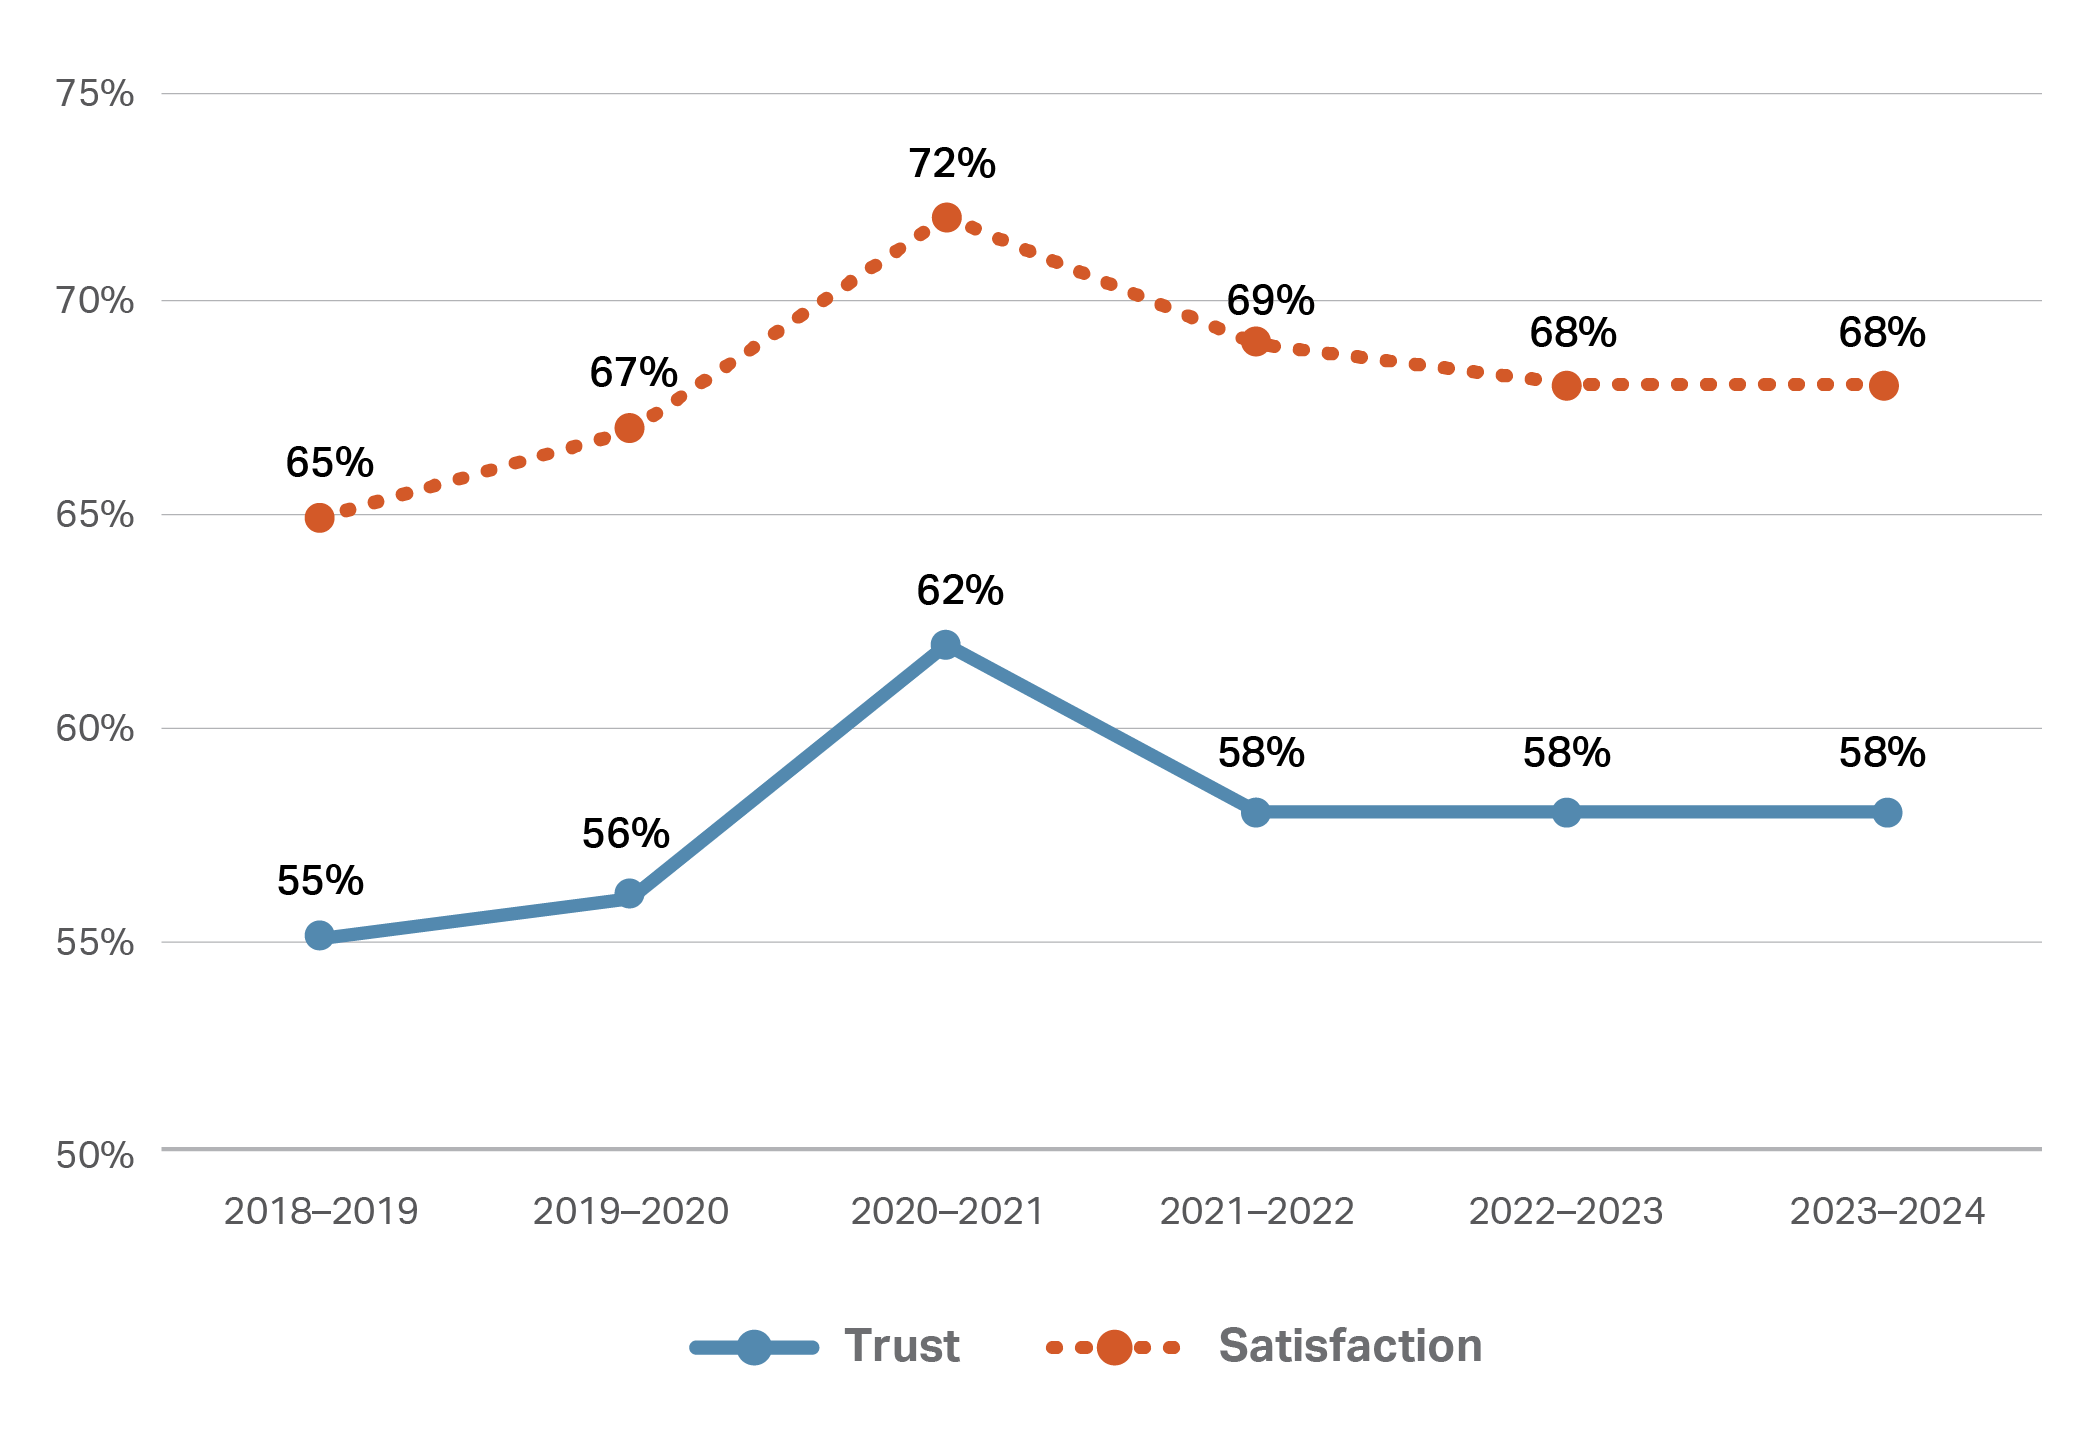
Trust[1] in and satisfaction[3] with Australian public services has remained stable since 2022.
As outlined in our conceptual model (see Appendix for more details), trust reflects people's expectations that their needs will be met, while satisfaction is determined by how well services meet those expectations. The stability suggests that public services are keeping pace with expectations. As expectations tend to grow over time, public services need to improve their performance to maintain trust and satisfaction.
Figure 1: Trust and satisfaction

Footnotes
[1] Q93 – Overall trust is the proportion of people who answered “Strongly agree” or “Agree” when asked “How much do you agree with the following statement – ‘I can trust Australian public services’”. It also includes a proportion of people who answered “Somewhat agree” before the method changes. See Appendix ”Method changes” for more details.
[3] Q24 – Satisfaction is the proportion of people who answered “Completely satisfied” or “Satisfied” when asked “Thinking about your overall experience with the above services, how satisfied or dissatisfied are you?” It also includes a proportion of people who answered “Somewhat satisfied” before the method changes. See Appendix ”Method changes” for more details.
[7] Q9 – Distrust is the proportion of people who answered “strongly disagree” or “disagree” when asked “How much do you agree with the following statement – ‘I can trust Australian public services’”. It also includes a proportion of people who answered “Somewhat disagree” before the method changes. See Appendix ”Method changes” for more details.
