[toc]
In 2022, most people trust Australian public services
Most people trust Australian public services, and believe they will change to meet Australians’ needs in the future
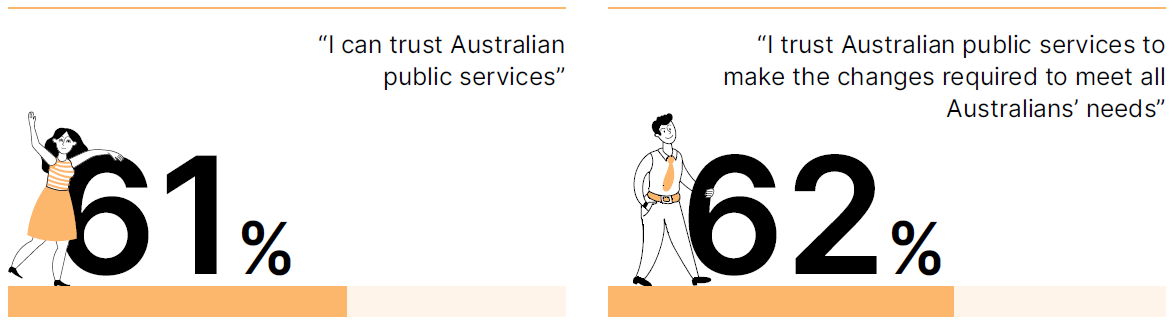
Trust results show percentage of people who said they “strongly agree”, “agree” or “somewhat agree” with the above statements.
How do we compare?
Trust in Australian public services is comparable with trust in New Zealand’s civil service, where 62% of people trust the public service brand in June 2022 Quarter (Kiwis Count).
Trust in Australian public services is comparable to trust in Australian businesses (61%) and higher than trust in Government (52%) (2022 Edelman Trust Barometer).
Trust in Australian public services is higher than trust in the national government (41%), trust in local government (47%) and trust in civil servants (50%) (2021 OECD Survey Report).
Trust in public services increased significantly during the COVID-19 pandemic
Significantly more people trusted public services in June 2020 when COVID-19 supports were introduced.
Trust in public services has been steady for the past year, remaining above prepandemic levels.
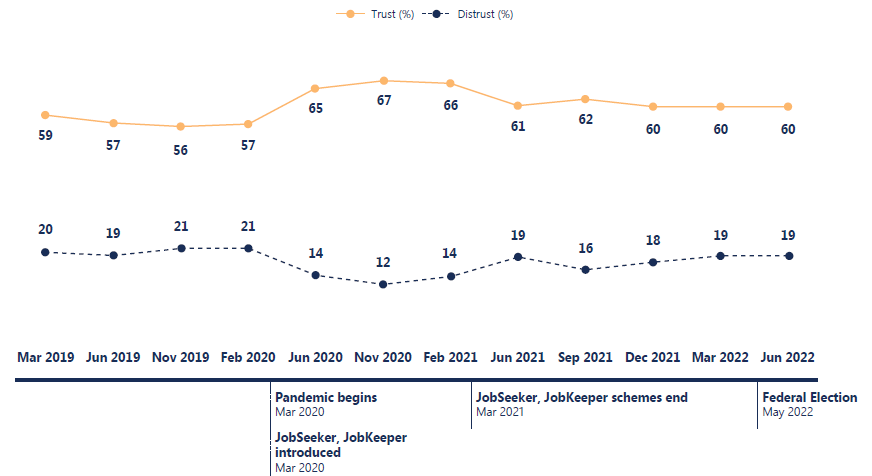
Trust results show percentage of people who said they “strongly agree”, “agree” or “somewhat agree” with the statement: “I can trust Australian public services”.
Distrust results show percentage of people who said they “strongly disagree”, “disagree” or “somewhat disagree” with the statement..
Approval of the federal government’s response to the pandemic down from 85% in July 2020 to 52% in July 2021, 2021 ANU Mapping Social Cohesion
People trust public services more when they have used them
Trust is 6pts higher for people who used services in 2022.
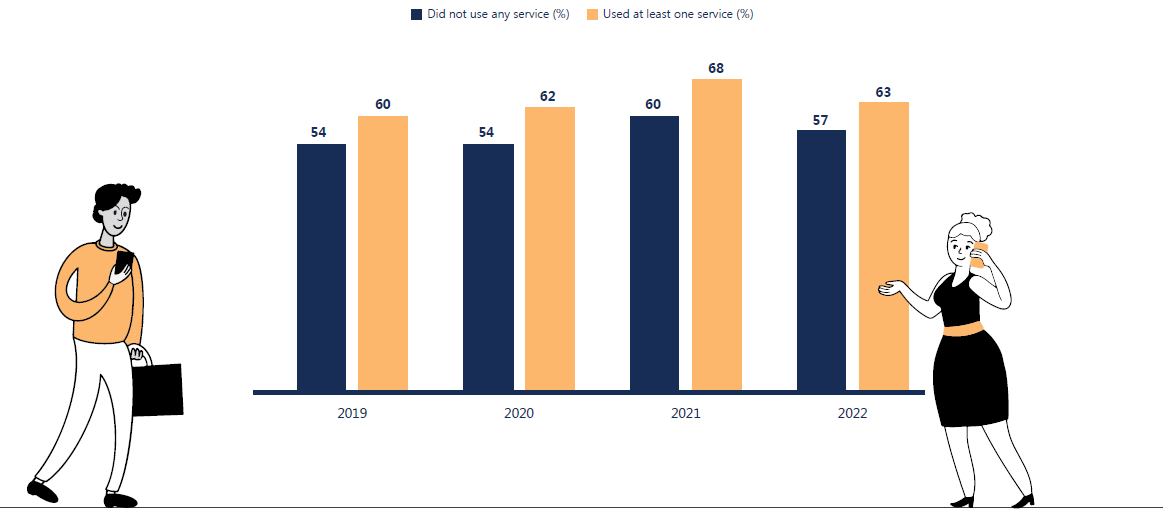
Trust results show percentage of people who said they “strongly agree”, “agree” or “somewhat agree” with the statement: “I can trust Australian public services”.
Results shown are for financial year periods: 2019 results are for survey waves in March 2019 and June 2019; 2020 results are based on data collected in November 2019, February 2020, and June 2020; results for 2021 are based on data collected in November 2020, February 2021, and June 2021; and 2022 results are based on data collected monthly from July 2021 to June 2022.
People who have used services think they are more reliable and have more integrity than people who have not
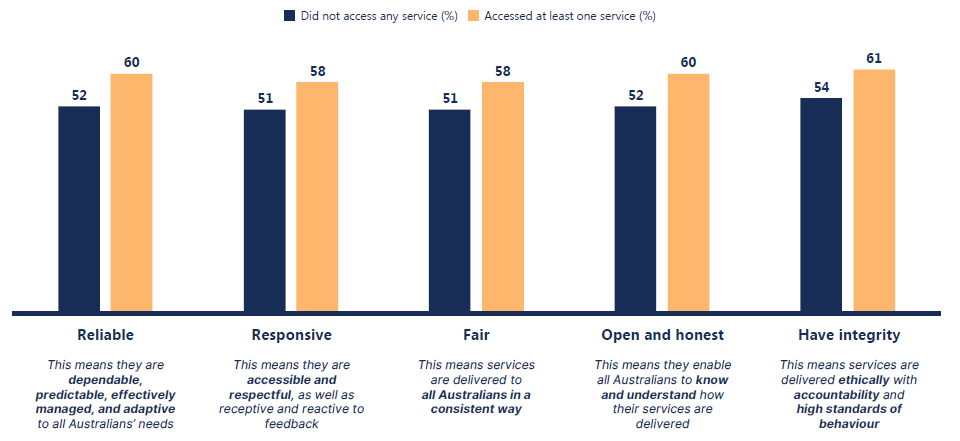
Results show percentage of people who “completely agreed, “agreed” and “somewhat agreed” with the statements. These statement are key drivers of trust in institutions, as developed by the OECD (2017 Guidelines on Measuring Trust).
In 2022, trust is high across all services but it varies significantly by service agency
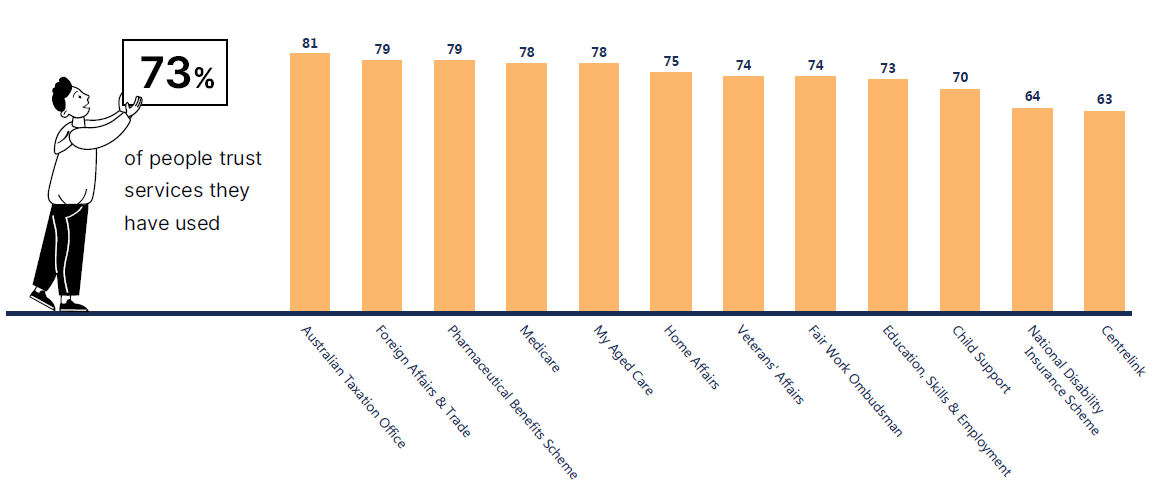
Trust results show percentage of people who said they “strongly agree”, “agree” or “somewhat agree” with the statement “The service is trustworthy” thinking about interactions with specific services they have used in the last 12 months.
Refer to Methodology – services results for more details on services.
Trust results across most services peaked in 2021 during the pandemic
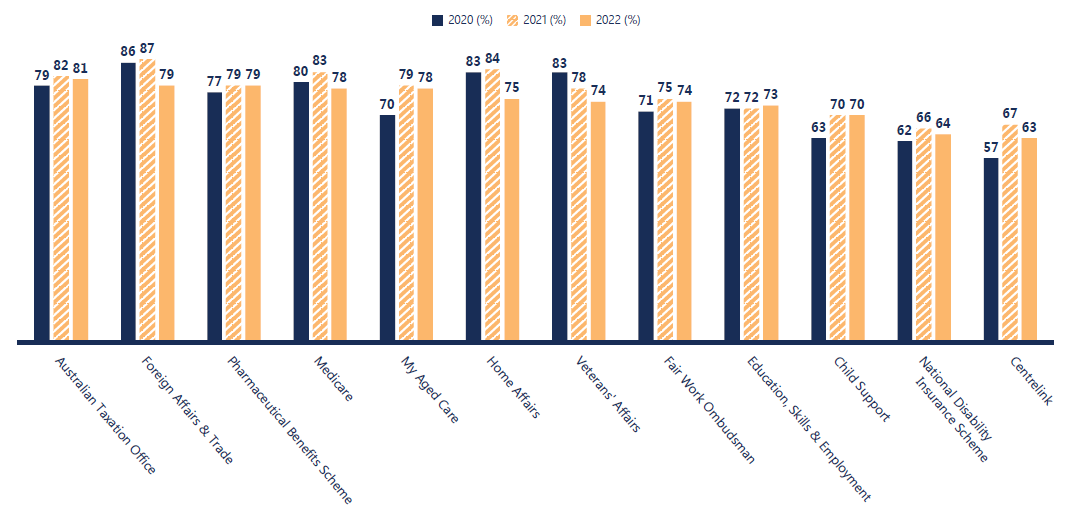
Trust results show percentage of people who said they “strongly agree”, “agree” or “somewhat agree” with the statement “The service is trustworthy”, thinking about interactions with specific services they have used in the last 12 months. Trust in all services was 72% in 2020; 76% in 2021; and 73% in 2022.
Results shown are for financial year periods: 2020 results are based on data collected in November 2019, February 2020, and June 2020; and results for 2021 are based on data collected in November 2020, February 2021, and June 2021. See Methodology for more details on past years’ collection and reporting frequency.
Migrant Australians have higher trust in Australian public services than people born in Australia
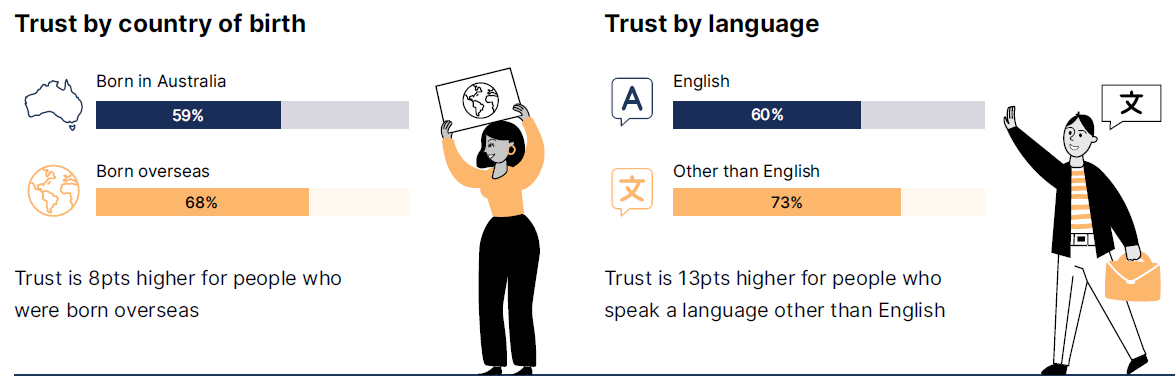
Trust results show percentage of people who said they “strongly agree”, “agree” or “somewhat agree” with the statement: “I can trust Australian public services”.
Satisfaction does not show the same difference, with people born overseas only being 3 percentage points higher than those born in Australia, and only 1 percentage points difference for those who speak a language other than English.
Do migrants have higher trust in services because they have lower expectations of public services than people born in Australia, and/or because they have experiences of other countries’ public services that were less trustworthy?
In a global landscape of declining institutional and interpersonal trust,* some people in Australia distrust public services
People who don’t trust other people have low trust in public services
Trust 38pts lower for people who are distrusting of others.
Distrust 26pts higher for people who are distrusting of others.
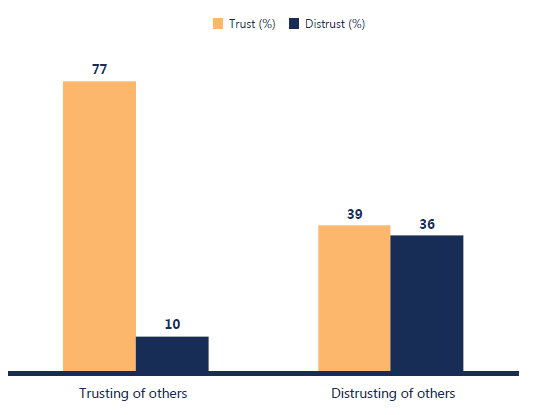
“Trusting of others” show percentage of people who said they “strongly agree”, “agree” or “somewhat agree” with the statement: “Most people can be trusted”.
“Distrusting of others” show people who said they “strongly disagree”, “disagree” or “somewhat disagree” with the same statement.
What makes people trust each other, and how do we increase trust in one another? Would improving trust in other people also improve trust in public services?
People in regional Australia trust public services less than those in metro areas
Trust is 7pts lower for people in regional areas in 2022.
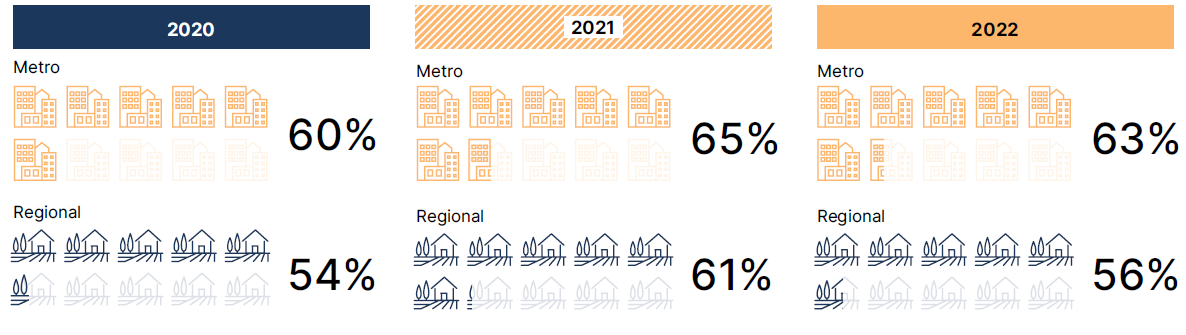
Satisfaction does not show the same difference, with people living in regional areas only being 1 percentage points lower than those living in metro areas.
Trust results show percentage of people who said they “strongly agree”, “agree” or “somewhat agree” with the statement: “I can trust Australian public services”. Satisfaction results show people, who have used public services in last 12 months, who said they were “completely satisfied”, “satisfied” and “somewhat satisfied” when asked “Thinking about your overall experience with the services, how satisfied or dissatisfied are you?”. Metro and regional areas defined using post code data and the ABS Australian Statistical Geography Standard.
Women trust public services significantly less than men
Trust was 10pts lower for women in June 2022
The trust gender gap is not seen in satisfaction with service results, with women’s satisfaction only between 1-4pts lower than men
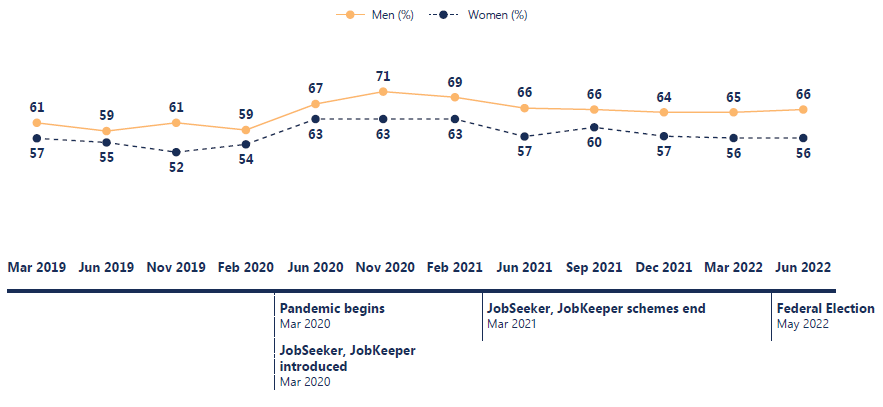
Trust results show percentage of people who said they “strongly agree”, “agree” or “somewhat agree” with the statement: “I can trust Australian public services”.
Can efforts to improve women’s equality and safety improve women’s trust in public services?
Edelman argues the media and government are fuelling a “cycle of distrust”, and are seen by many as divisive forces in society. Media commentary on women’s safety and Parliamentary safety in early 2021 may have influenced both men and women’s trust to significantly decline in June 2021, and account for women’s decline being twice that of men.
People who face overlapping marginalisation have higher levels of distrust
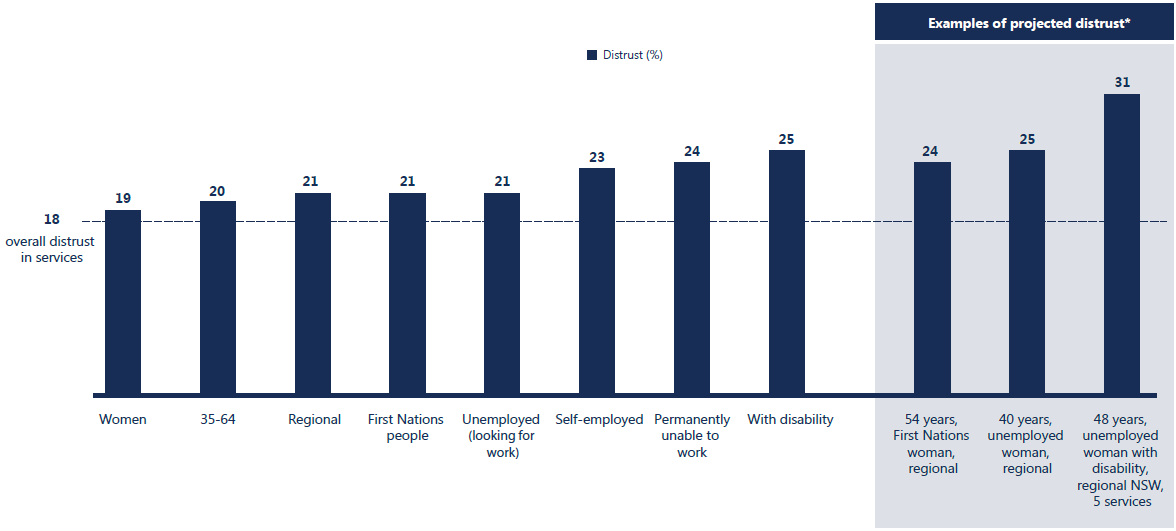
Distrust results show percentage of people who said they “strongly disagree”, “disagree” or “somewhat disagree” with the statement: “I can trust Australian public services”.
*Distrust results have been projected for demographic personas with overlapping marginalisation. Projections made using a logistic regression model.