[toc]
Most people are satisfied with public servants, and are getting what they need from public services
Three in four people are satisfied and getting what they need from public services

* Result shows percentage of people who have used public services in the last 12 months who were “completely satisfied”, “satisfied” and “somewhat satisfied” when asked “Thinking about your interactions with the services, how satisfied or dissatisfied are you?”.
**Results show people who “completely agree”, “agree” or “somewhat agree” with the statements. Some of the statements have been shortened for space in the graph, in the survey they appear as: “The websites or applications I used worked well”; “It was easy to access the service(s)”; “It was easy to find out about the service(s)”; “The amount of effort I had to put in was reasonable”; “The amount of time it took to reach an outcome was acceptable”; “I was kept informed of progress and wait times throughout”; “It was clear I could give feedback about my experience”.
Public servants mostly seen to act professionally and make people feel respected

Results show people who “completely agree”, “agree” or “somewhat agree” with the statements. The statements have been shortened for space in the graph, in the survey they appear as: “Staff treated me with respect”; “Staff did what they said they would do”; “Staff were knowledgeable”; “Information from the service was accurate”; “Information from the service was easy to understand”; “The service explained how my personal information would be used and stored”; “The service understood my individual needs”; “The service provided clear information about the process and how decisions are made.”
In 2022, satisfaction is high across all services but experiences vary across service agencies

Satisfaction results show percentage of people, who have used public services in last 12 months, who said they were “completely satisfied”, “satisfied” and “somewhat satisfied” when asked “Thinking about your interactions with the services, how satisfied or dissatisfied are you?”.
Refer to Methodology – services results for more details on services.
Satisfaction across most services increased in 2021 during the pandemic

Satisfaction with all services was 72% in 2020, 77% in 2021 and 73% in 2022.
Satisfaction results show percentage of people, who have used public services in last 12 months, who said they were “completely satisfied”, “satisfied” and “somewhat satisfied” when asked “Thinking about your interactions with the services, how satisfied or dissatisfied are you?”.
Refer to Methodology – services results for more details on services.
More people aged 65 and over trust and are satisfied with public services than other ages

Trust results show percentage of people who said they “strongly agree”, “agree” or “somewhat agree” with the statement: “I can trust Australian public services”. Satisfaction results show people, who have used public services in last 12 months, who said they were “completely satisfied”, “satisfied” and “somewhat satisfied” when asked “Thinking about your overall experience with the services, how satisfied or dissatisfied are you?”.
Trust and satisfaction with public services varies across states
People who live in the Australian Capital Territory have the highest trust and satisfaction with Australian public services while people who live in Tasmania have the lowest trust and satisfaction with Australian public services

Trust results show percentage of people who said they “strongly agree”, “agree” or “somewhat agree” with the statement: “I can trust Australian public services”.
Satisfaction results show people, who have used public services in last 12 months, who said they were “completely satisfied”, “satisfied” and “somewhat satisfied” when asked “Thinking about your overall experience with the services, how satisfied or dissatisfied are you?”.
Results show trust and satisfaction with Australian public services, also known as Federal, National or Commonwealth services, by location. Results do not reflect feedback on state, territory or local public services.
Although most people have had a positive service experience, others are having a harder time using services
People with a disability are less satisfied with all public services they use, and are less likely to get what they need from them than people without a disability

Satisfaction results show the percentage of people who identified as having a disability or disabilities and had used public services in last 12 months who were “completely satisfied”, “satisfied” and “somewhat satisfied” when asked “Thinking about your interactions with the services, how satisfied or dissatisfied are you?”. Dissatisfaction results show the percentage who were “completely dissatisfied”, “dissatisfied” and “somewhat dissatisfied”.
Results on the right show the percentage of people who identified as having a disability or disabilities and had used public services in last 12 months who “completely agree”, “agree” or “somewhat agree” with the statements. The statements have been shortened for space in the graph, in the survey they appear as: “The websites or applications I used worked well”; “It was easy to access the service(s)”; “It was easy to find out about the service(s)”; “The amount of effort I had to put in was reasonable”; “The amount of time it took to reach an outcome was acceptable”; “I was kept informed of progress and wait times throughout”; “It was clear I could give feedback about my experience.”
People with disability are more satisfied with Medicare than the National Disability Insurance Scheme

Medicare and NDIS satisfaction results show the percentage of people who identified as having a disability or disabilities and had used public services in last 12 months who were “completely satisfied”, “satisfied” and “somewhat satisfied” when asked “Thinking about your overall experience with [Medicare/NDIS], how satisfied or dissatisfied are you?”.
Results on the graph show, from the same cohort of people, the percentage who “completely agreed”, “agreed” and “somewhat agreed” with the statements about Medicare or NDIS services specifically. The statements have been shortened for space in the graph, in the survey they appear as: “The service is reliable”; “Information from the service was accurate”; “The service understood my individual needs”; “The service is fair”; “The service is responsive”; “Staff treated me with respect”; “The service has integrity”; “The service provided clear information about the process and how decisions are made”; “Staff did what they said they would do”; “Staff were knowledgeable”; “The service is open and honest”; “Information from the service was easy to understand”; “The service explained how my personal information would be used and stored”.
Statements are listed in the order of their influence on trust and satisfaction based on regression analysis.
Refer to Methodology – services results for more details on services.
More unemployed people are dissatisfied with public services than employed people, and fewer think the time it took to get an outcome was acceptable

Satisfaction results show the percentage of people who indicated they were or had been unemployed and had used public services in last 12 months who were “completely satisfied”, “satisfied” and “somewhat satisfied” when asked “Thinking about your interactions with the services, how satisfied or dissatisfied are you?”. Dissatisfaction results show the percentage of the same cohort of people who were “completely dissatisfied”, “dissatisfied” and “somewhat dissatisfied”.
Results on the right show the percentage of the same cohort of people who “completely agree”, “agree” or “somewhat agree” with the statements. The statements have been shortened for space in the graph, in the survey they appear as: “The websites or applications I used worked well”; “It was easy to access the service(s)”; “It was easy to find out about the service(s)”; “The amount of effort I had to put in was reasonable”; “The amount of time it took to reach an outcome was acceptable”; “I was kept informed of progress and wait times throughout”; “It was clear I could give feedback about my experience”.
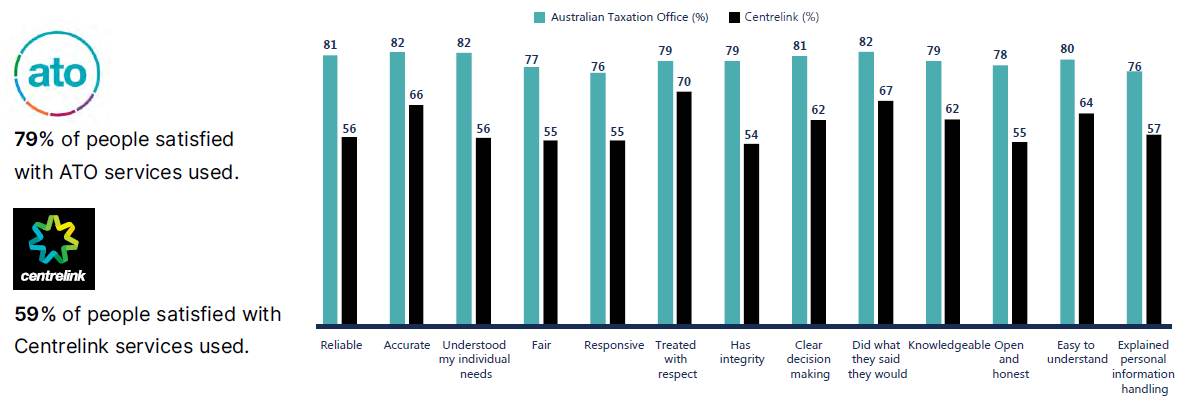
Unemployed people use Centrelink more than the Australian Taxation Office,* and are less satisfied with Centrelink services than ATO services

* There are 3.4 times more unemployed people accessing Centrelink, than unemployed people accessing ATO services.
ATO and Centrelink satisfaction results show the percentage of people who indicated they were or had been unemployed in the past 12 months who said they were “completely satisfied”, “satisfied” and “somewhat satisfied” when asked “Thinking about your overall experience with [Centrelink/ATO], how satisfied or dissatisfied are you?”.
Results on the graph show people who “completely agreed, “agreed” and “somewhat agreed” with the statements when asked about Centrelink and ATO services specifically. The statements have been shortened for space in the graph, in the survey they appear as: “The service is reliable”; “Information from the service was accurate”; “The service understood my individual needs”; “The service is fair”; “The service is responsive”; “Staff treated me with respect”; “The service has integrity”; “The service provided clear information about the process and how decisions are made”; “Staff did what they said they would do”; “Staff were knowledgeable”; “The service is open and honest”; “Information from the service was easy to understand”; “The service explained how my personal information would be used and stored”.
Statements are listed in the order of their influence on trust and satisfaction based on regression analysis.
Refer to Methodology – services results for more details on services.
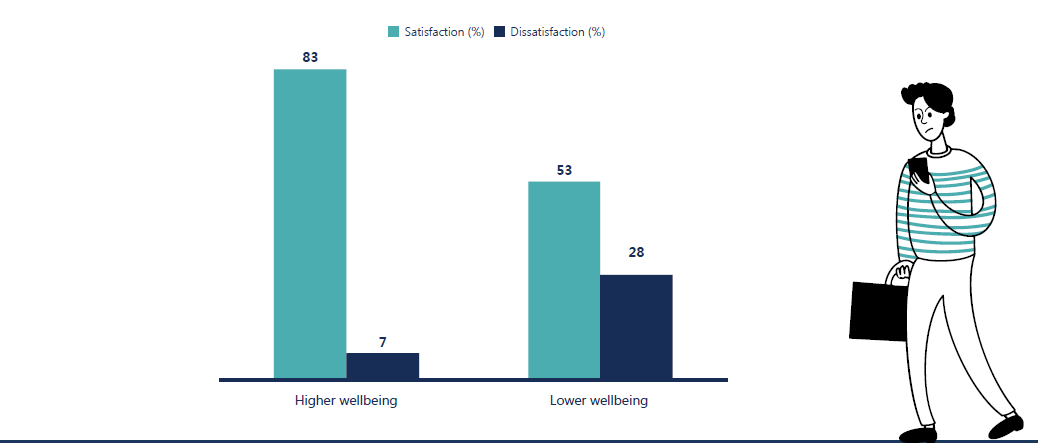
People with low overall wellbeing are less satisfied with public services

Satisfaction results show percentage of people, who have used public services in last 12 months, who said they were “completely satisfied”, “satisfied” and “somewhat satisfied” when asked “Thinking about your interactions with the services, how satisfied or dissatisfied are you?”.
“Higher wellbeing” show people who responded with “completely satisfied”, “satisfied” and “somewhat satisfied” to the statement: “overall how satisfied or dissatisfied are you with life as a whole these days?”. “Lower wellbeing” show people who said they are “completely dissatisfied”, “dissatisfied” and “somewhat dissatisfied” to the statement. Measuring subjective wellbeing this way is consistent with the OECD Guidelines on measuring subjective wellbeing.
Can programs to improve people’s overall wellbeing improve satisfaction with public services?
